3:30 p.m. New York time
Half an hour before the closing bell. The S&P 500 futures reversed to the upside.
Elliott Wave Theory: By my analysis, the 4th-wave downward correction that began on November 11 ended at today’s session low, 5855, and a 5th-wave upward correction, wave 5{-11} on the chart, has begun.
The rise carrie the price above the end of the previous wave, 5933 on November 18, a downward 5th-wave — wave 5{-13) — within the final subwave, wave C, within a larger 4th-wave downward correction that began on November 11 from 6053.35.
That break-above doesn’t break any rules of Elliott Wave Theory, so isn’t inconsistent with a continuation of the smaller 4th wave listed above, the principal analysis from this morning. On the other hand, it isn’t inconsistent with the low set in today’s session.
This morning’s analysis had wave 5{-13} still underway. I’ve marked the chart a thought wave 5{-13} ended at the low point.
If the price reduces and falls below 5933, then my analysis tripped over the bottom fishing and the November 11 wave 4 is still underway.
9:35 a.m. New York time
What’s happening now? The S&P 500 E-mini futures declined overnight, from the 5930s to the 5850s.
What does it mean? Elliott Wave Theory defines the fall as the onset of the 5th wave within a larger C wave, the final subwave within the 4th-wave downward correction that began on November 11.
A wave on the chart is labelled with a wave number and subscript in curly brackets showing the wave’s position within the fractal structure of the chart in relation to the Intermediate degree, currently wave 5{0}, which began in December 2018.
In the smaller wave structure now under discussion, from larger to smaller, the 4th-wave downward correction is wave 4{-11}, which is in wave C{-12}, which in turn is navigating through wave 5{-13}.
The third wave is quite often the longest in a series of five waves. Wave 3{-13} took 16.5 hours start to finish. The present wave 5{-13} has been underway for 24 hours.
There’s no rule that says how much time a 5th wave must take, nor its length in relationship to the preceding 3rd wave. The only rule is that wave 3 can’t be shorter than both waves 1 and 5.
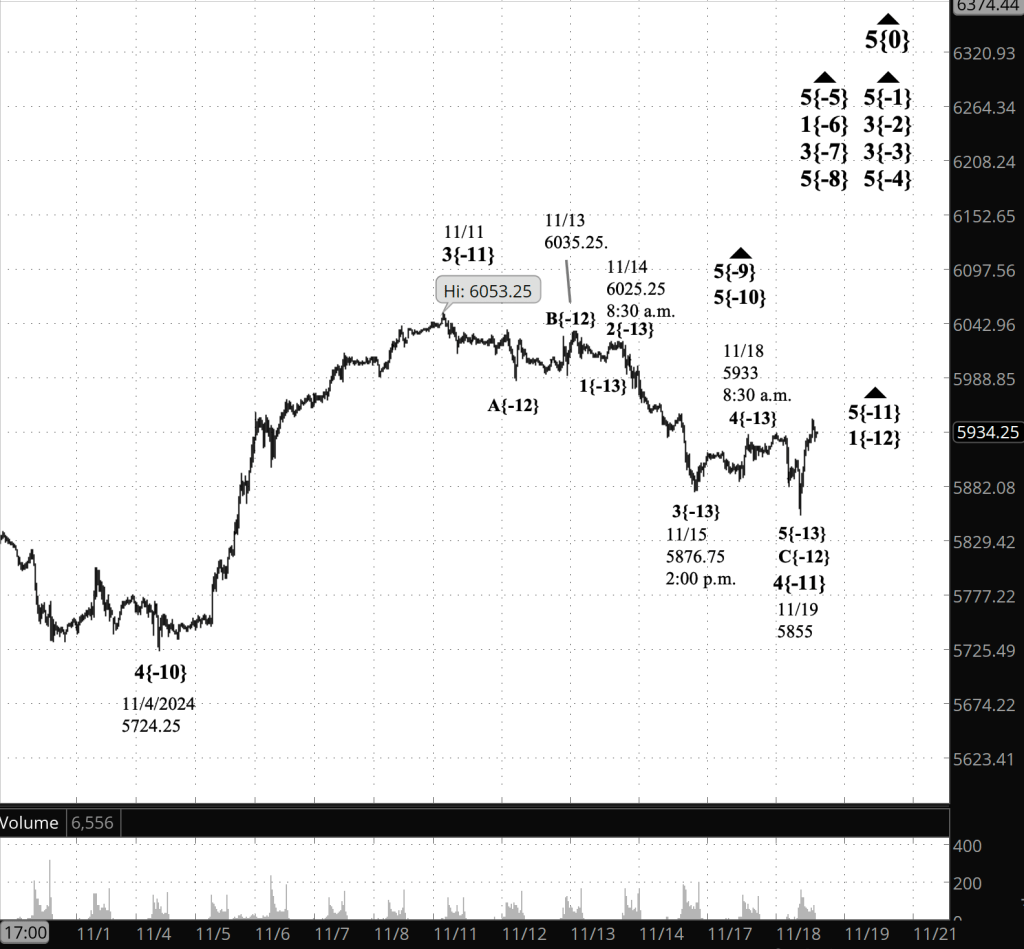
[S&P 500 E-mini futures at 3:30 p.m., 30-minute bars, with volume]
What are the alternatives? In the past few days I’ve counted the 4th-wave downward correction since November 11 as being in its final subwave. It’s possible that the whole pattern is the 1st subwave, wave A, and the A-B-C pattern is one degree lower, and that is the alternative analysis. Unless something happens to change the analysis, I’m removing it after today as no longer likely.
What does Elliott wave theory say? Here are the waves that underly the analyses.
Principal Analysis: (updated to match the afternoon analysis)
- .Principal Analysis:
- Rising wave 5{0} is underway. It is a wave of Intermediate degree that began in December 2018.
- It is in its final subwave, wave 5{-1}.
- Within wave 5{-1}, rising waves 5{-2}, 5{-3} and 5{-4} are underway, as is wave 5{-5}.
- Wave 5{-5} is in its initial subwave, wave 1{-6}, which in turn is in its middle subwave, wave 3{-7}.
- Wave 3{-7} is in its final; subwave, uptrending wave 5{-8}.
- Wave 5{-8} is in its final subwave, wave 5{-9}, which is in its final subwave, uptrending wave 5{-10}.
- Wave 5{-10} is in its final subwave, wave 5{-11}.
Long-term Waves.
(Updated to match the afternoon analysis.)
These are the waves currently in progress under my principal analysis. Each line on the list shows the wave number, with the subscript in curly brackets, the traditional degree name, the starting date, the starting price of the S&P 500 E-mini futures, and the direction of the wave.
- S&P 500 Index:
- 5{+3} Supercycle, 7/8/1932, 4.40 (up)
- 5{+2} Cycle, 12/9/1974, 60.96 (up)
- 5{+1} Primary, 3/6/2009, 666.79 (up)
- 5{0} Intermediate, 12/26/2018, 2346.58 (up)
- S&P 500 Futures
- 5{-1} Minor, 10/27/2023, 4127.25 (up)
- 3{-2} Minute, 10/27/23, 4127.75 (up)
- 3{-3} Minuette, 10/27/23, 4127.75 (up)
- 5{-4} Subminuette, 4/18/2024, 4963.50 (up)
- 5{-5} Micro, 8/5/2024, 5120 (up)
- 1{-6} Submicro, 8/5/2024, 5120 (up)
- 3{-7} Minuscule, 8/7/2024, 5182 (up)
- 5{-8} (unnamed), 9/6/2024, 5394 (up)
- 5{-9} (unnamed), 10/2/2024, 5724 (up)
- 5{-10} (unnamed), 11/4/2024, 5824.25 (up)
- 5{-11} (unnamed), 11/19/2024, 5933 (up)
Reading the chart. Price movements — waves – – in Elliott wave analysis are labeled with numbers within trending waves and letters with corrective waves. The subscripts — numbers in curly brackets — designate the wave’s degree, which, in Elliott wave analysis, means the relative position of a wave within the larger and smaller structures that make up the chart. R.N. Elliott, who in the 1930s developed the form of analysis that bears his name, viewed the chart as a complex structure of smaller waves nested within larger waves, which in turn are nested within still larger waves. In mathematics it’s called a fractal structure, where at every scale the pattern is similar to the others.
Learning and other resources. Elliott wave analysis provides context, not prophecy. As the 20th century semanticist Alfred Korzybski put it in his book Science and Sanity (1933), “The map is not the territory … The only usefulness of a map depends on similarity of structure between the empirical world and the map.” And I would add, in the ever-changing markets, we can judge that similarity of structure only after the fact.
See the menu page Analytical Methods for a rundown on where to go for information on Elliott wave analysis.
By Tim Bovee, Portland, Oregon, November 19, 2024
Disclaimer
Tim Bovee, Private Trader tracks the analysis and trades of a private trader for his own accounts. Nothing in this blog constitutes a recommendation to buy or sell stocks, options or any other financial instrument. The only purpose of this blog is to provide education and entertainment.
No trader is ever 100 percent successful in his or her trades. Trading in the stock and option markets is risky and uncertain. Each trader must make trading decisions for his or her own account, and take responsibility for the consequences.
License
All content on Tim Bovee, Private Trader by Timothy K. Bovee is licensed under a Creative Commons Attribution-ShareAlike 4.0 International License.
Based on a work at www.timbovee.com.

You must be logged in to post a comment.