After the holiday. U.S. markets will close early today, at 1 p.m. New York time.
12:30 p.m. New York time
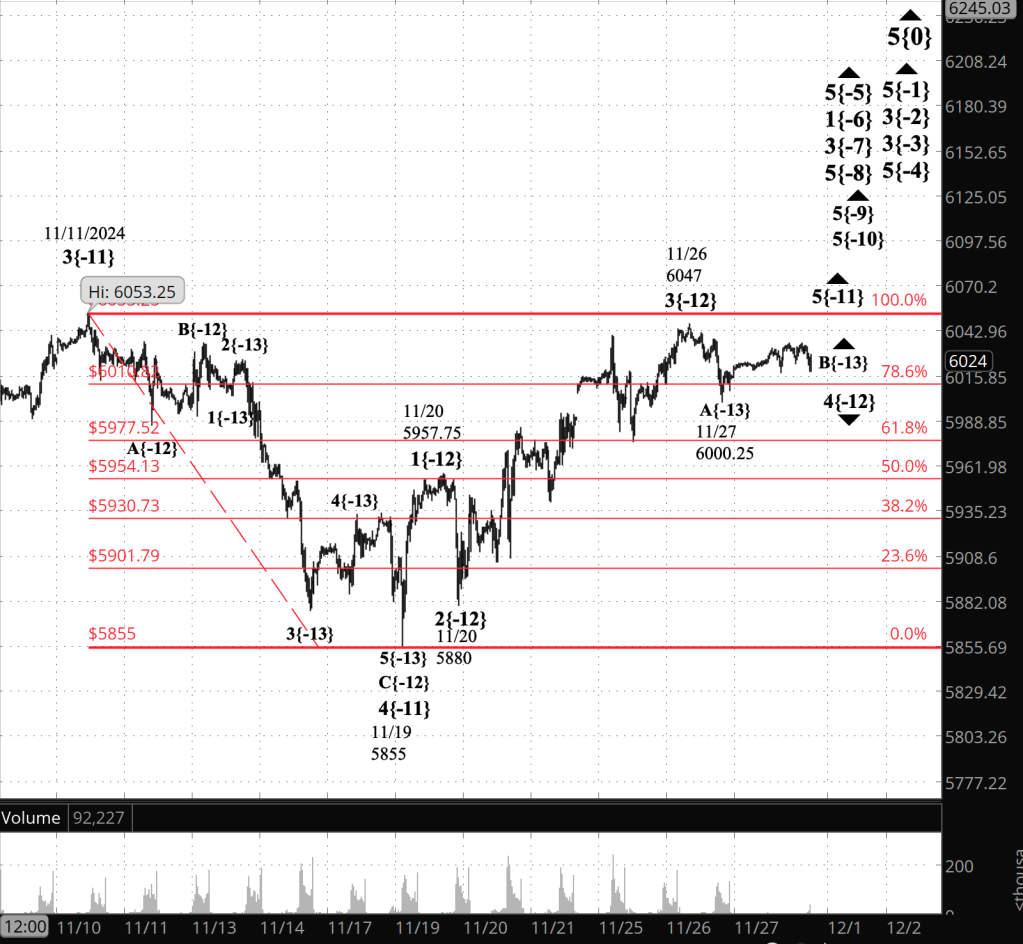
Half an hour before the closing bell. The S&P 500 futures used the truncated post-holiday session to do something interesting under the rules of Elliott Wave Theory.
Those rules say that a B-wave can’t move beyond the start of the preceding A wave. If it does, then its not a B wave.
During today’s session what I had labeled a B wave violated that rule, a possibility recognised as an alternative in this morning’s analysis, and I’ve redone the analysis.
What had been wave B ended on November 27, and wave C swiftly followed on the same day. That marked the end of the 4th-wave downward correction that began on November 26.
Rising wave 5 began, within the larger 5th-wave uptrend that began on November 19.
I’ve added a new chart that allows a view of what changed.
[S&P 500 E-mini futures at 12:30 p.m., 35-minute bars, with volume]
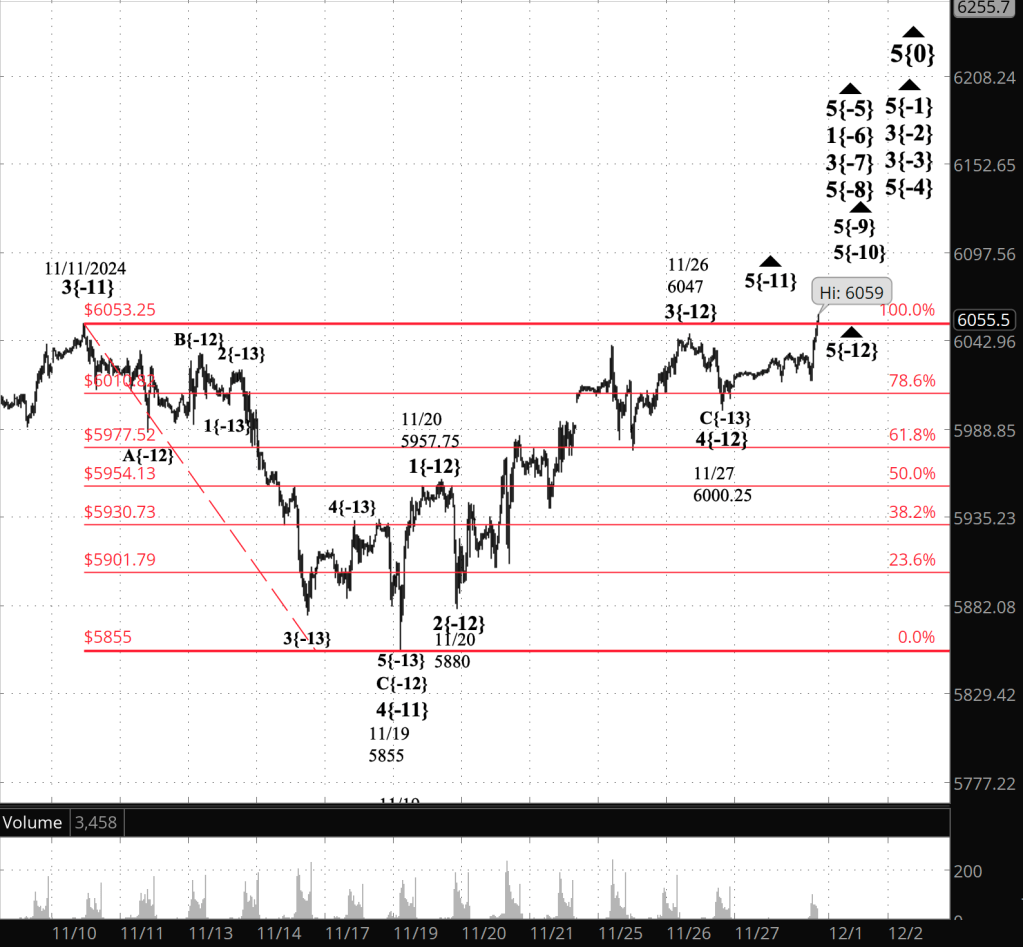
9:35 a.m. New York time
What’s happening now? The S&P 500 E-mini futures remained range bound, from the 6010s to the 6030s, after trading resumed overnight in what was a net sideways movement.
What does it mean? The price stayed below the November 26 high, which Elliott Wave Theory interprets as meaning that the 4th-wave downward correction that began on that date continues and is in its middle subwave, wave B.
Now outdated: [S&P 500 E-mini futures at 9:35 a.m., 35-minute bars, with volume]
S&P 500 E-mini futures at 9:35 a.m., 35-minute bars, with volume]
What are the alternatives? There is a bit ambiguity over the subwaves of the 3rd-wave uptrend that began on November 20. My present labeling appears to best match the size of earlier movements of the same degrees. Also, it’s possible that wave B ended at the overnight high, 6035.50.
What does Elliott wave theory say? Here are the waves that underly the analyses, updated with the afternoon analysis.
Principal Analysis:
- .Rising wave 5{0} is underway. It is a wave of Intermediate degree that began in December 2018.
- It is in its final subwave, wave 5{-1}.
- Within wave 5{-1}, rising waves 5{-2}, 5{-3} and 5{-4} are underway, as is wave 5{-5}.
- Wave 5{-5} is in its initial subwave, wave 1{-6}, which in turn is in its middle subwave, wave 3{-7}.
- Wave 3{-7} is in its final; subwave, uptrending wave 5{-8}.
- Wave 5{-8} is in its final subwave, wave 5{-9}, which is in its final subwave, uptrending wave 5{-10}.
- Wave 5{-10} is in its final subwave, wave 5{-11}, which appears to have completed its middle subwave, wave 3{-12}, within wave 5{-13}.
- Wave 5{-12} is now underway.
Long-term Waves.
These are the waves currently in progress under my principal analysis. Each line on the list shows the wave number, with the subscript in curly brackets, the traditional degree name, the starting date, the starting price of the S&P 500 E-mini futures, and the direction of the wave.
- S&P 500 Index:
- 5{+3} Supercycle, 7/8/1932, 4.40 (up)
- 5{+2} Cycle, 12/9/1974, 60.96 (up)
- 5{+1} Primary, 3/6/2009, 666.79 (up)
- 5{0} Intermediate, 12/26/2018, 2346.58 (up)
- S&P 500 Futures
- 5{-1} Minor, 10/27/2023, 4127.25 (up)
- 3{-2} Minute, 10/27/23, 4127.75 (up)
- 3{-3} Minuette, 10/27/23, 4127.75 (up)
- 5{-4} Subminuette, 4/18/2024, 4963.50 (up)
- 5{-5} Micro, 8/5/2024, 5120 (up)
- 1{-6} Submicro, 8/5/2024, 5120 (up)
- 3{-7} Minuscule, 8/7/2024, 5182 (up)
- 5{-8} (unnamed), 9/6/2024, 5394 (up)
- 5{-9} (unnamed), 10/2/2024, 5724 (up)
- 5{-10} (unnamed), 11/4/2024, 5824.25 (up)
- 5{-11} (unnamed), 11/19/2024, 5933 (up)
- 5{-12} (unnamed), 11/27/2024, 6000.25 (up)
Reading the chart. Price movements — waves – – in Elliott wave analysis are labeled with numbers within trending waves and letters with corrective waves. The subscripts — numbers in curly brackets — designate the wave’s degree, which, in Elliott wave analysis, means the relative position of a wave within the larger and smaller structures that make up the chart. R.N. Elliott, who in the 1930s developed the form of analysis that bears his name, viewed the chart as a complex structure of smaller waves nested within larger waves, which in turn are nested within still larger waves. In mathematics it’s called a fractal structure, where at every scale the pattern is similar to the others.
Learning and other resources. Elliott wave analysis provides context, not prophecy. As the 20th century semanticist Alfred Korzybski put it in his book Science and Sanity (1933), “The map is not the territory … The only usefulness of a map depends on similarity of structure between the empirical world and the map.” And I would add, in the ever-changing markets, we can judge that similarity of structure only after the fact.
See the menu page Analytical Methods for a rundown on where to go for information on Elliott wave analysis.
By Tim Bovee, Portland, Oregon, November 29, 2024
Disclaimer
Tim Bovee, Private Trader tracks the analysis and trades of a private trader for his own accounts. Nothing in this blog constitutes a recommendation to buy or sell stocks, options or any other financial instrument. The only purpose of this blog is to provide education and entertainment.
No trader is ever 100 percent successful in his or her trades. Trading in the stock and option markets is risky and uncertain. Each trader must make trading decisions for his or her own account, and take responsibility for the consequences.
License
All content on Tim Bovee, Private Trader by Timothy K. Bovee is licensed under a Creative Commons Attribution-ShareAlike 4.0 International License.
Based on a work at www.timbovee.com.

You must be logged in to post a comment.