3:30 p.m. New York time
Half an hour before the closing bell. The S&P 500 futures dropped to the 6040s during the session and then retraced much of the decline. Elliott Wave Theory: A small corrective wave continues within a 5th-wave uptrend that began on November 27 from 6000.25.
9:35 a.m. New York time
What’s happening now? The S&P 500 E-mini futures traded sideways in a relatively narrow range, bouncing between the 6060s and the 6050s
What does it mean? The overnight sideways movement was a continuation of a larger pattern that began on December 2. In the terminology of Elliott Wave Theory, the movement represents a low-degree correction, a subwave within a series of nested rising 5th waves, each one degree larger than the previous one.
So far this week, traders have had little economic motivation to bid the S&P 500 higher or lower. The first major report of the week, the private-sector ADP Employment Report, will be published on December 4 (Wednesday), serving as a sneak preview of the even more significant Employment Situation Report, which will be released by the federal government on December 6 (Friday). Each report will be issued before the opening bell.
The presumption is that higher unemployment results are bearish, signaling economic weakness, while a lower unemployment rate is generally bullish, reflecting economic strength. However, exceptionally low unemployment can raise inflationary concerns, potentially leading to tighter monetary policy.
When the present lower-degree 5th wave is complete, it will simultaneously mark the end of five increasingly larger 5th waves, each one degree higher than the previous one.
It will also signify the end of a 3rd wave of one degree higher still and the beginning of a 4th-wave downward correction, which will be larger than those seen recently. The 3rd wave began on August 7 at 5182 and has so far carried the price up by slightly more than $900 per share.
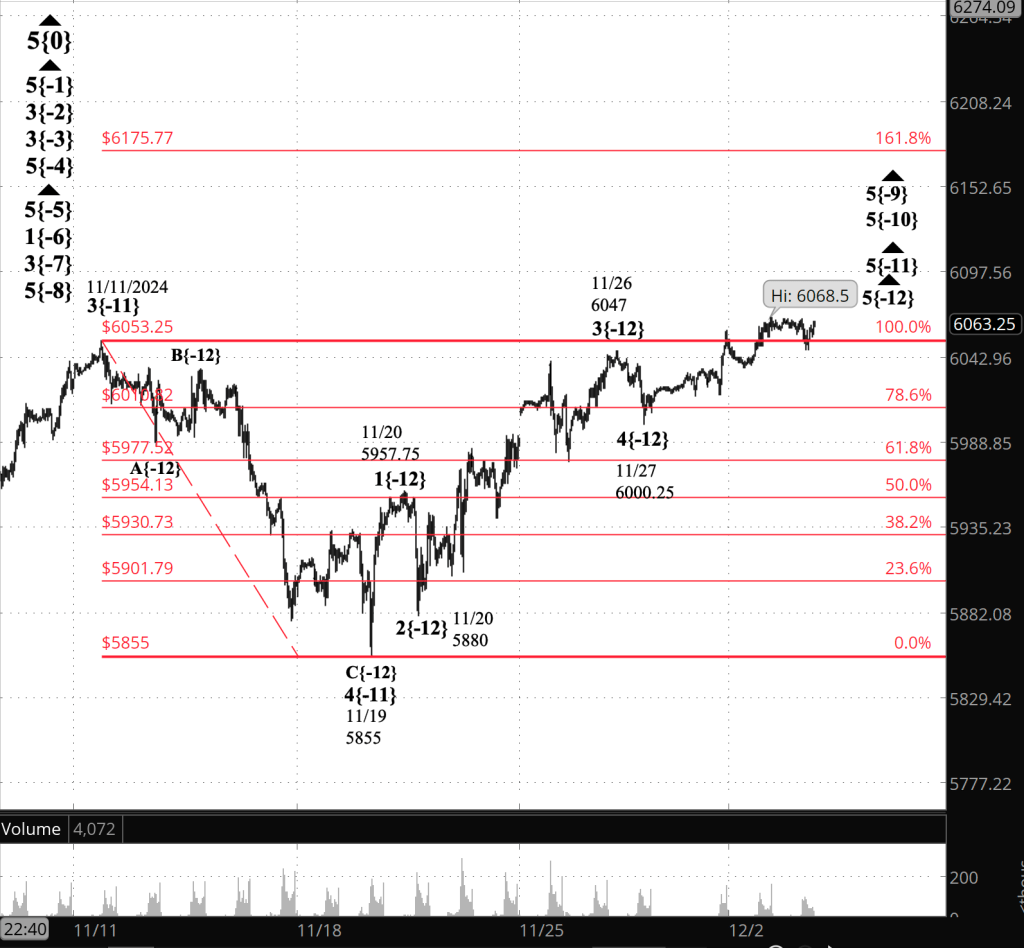
[S&P 500 E-mini futures at 3:30 p.m., 40-minute bars, with volume]
What are the alternatives? None at present.
What does Elliott wave theory say? Here are the waves that underly the analyses.
Principal Analysis:
- .Rising wave 5{0} is underway. It is a wave of Intermediate degree that began in December 2018.
- It is in its final subwave, wave 5{-1}.
- Within wave 5{-1}, rising waves 5{-2}, 5{-3} and 5{-4} are underway, as is wave 5{-5}.
- Wave 5{-5} is in its initial subwave, wave 1{-6}, which in turn is in its middle subwave, wave 3{-7}.
- Wave 3{-7} is in its final; subwave, uptrending wave 5{-8}.
- Wave 5{-8} is in its final subwave, wave 5{-9}, which is in its final subwave, uptrending wave 5{-10}.
- Wave 5{-10} is in its final subwave, wave 5{-11}, which appears to have completed its middle subwave, wave 3{-12}, within wave 5{-13}.
- Wave 5{-12} is now underway.
Long-term Waves.
These are the waves currently in progress under my principal analysis. Each line on the list shows the wave number, with the subscript in curly brackets, the traditional degree name, the starting date, the starting price of the S&P 500 E-mini futures, and the direction of the wave.
- S&P 500 Index:
- 5{+3} Supercycle, 7/8/1932, 4.40 (up)
- 5{+2} Cycle, 12/9/1974, 60.96 (up)
- 5{+1} Primary, 3/6/2009, 666.79 (up)
- 5{0} Intermediate, 12/26/2018, 2346.58 (up)
- S&P 500 Futures
- 5{-1} Minor, 10/27/2023, 4127.25 (up)
- 3{-2} Minute, 10/27/23, 4127.75 (up)
- 3{-3} Minuette, 10/27/23, 4127.75 (up)
- 5{-4} Subminuette, 4/18/2024, 4963.50 (up)
- 5{-5} Micro, 8/5/2024, 5120 (up)
- 1{-6} Submicro, 8/5/2024, 5120 (up)
- 3{-7} Minuscule, 8/7/2024, 5182 (up)
- 5{-8} (unnamed), 9/6/2024, 5394 (up)
- 5{-9} (unnamed), 10/2/2024, 5724 (up)
- 5{-10} (unnamed), 11/4/2024, 5824.25 (up)
- 5{-11} (unnamed), 11/19/2024, 5933 (up)
- 5{-12} (unnamed), 11/27/2024, 6000.25 (up)
Reading the chart. Price movements — waves – – in Elliott wave analysis are labeled with numbers within trending waves and letters with corrective waves. The subscripts — numbers in curly brackets — designate the wave’s degree, which, in Elliott wave analysis, means the relative position of a wave within the larger and smaller structures that make up the chart. R.N. Elliott, who in the 1930s developed the form of analysis that bears his name, viewed the chart as a complex structure of smaller waves nested within larger waves, which in turn are nested within still larger waves. In mathematics it’s called a fractal structure, where at every scale the pattern is similar to the others.
Learning and other resources. Elliott wave analysis provides context, not prophecy. As the 20th century semanticist Alfred Korzybski put it in his book Science and Sanity (1933), “The map is not the territory … The only usefulness of a map depends on similarity of structure between the empirical world and the map.” And I would add, in the ever-changing markets, we can judge that similarity of structure only after the fact.
See the menu page Analytical Methods for a rundown on where to go for information on Elliott wave analysis.
By Tim Bovee, Portland, Oregon, December 3, 2024
Disclaimer
Tim Bovee, Private Trader tracks the analysis and trades of a private trader for his own accounts. Nothing in this blog constitutes a recommendation to buy or sell stocks, options or any other financial instrument. The only purpose of this blog is to provide education and entertainment.
No trader is ever 100 percent successful in his or her trades. Trading in the stock and option markets is risky and uncertain. Each trader must make trading decisions for his or her own account, and take responsibility for the consequences.
License
All content on Tim Bovee, Private Trader by Timothy K. Bovee is licensed under a Creative Commons Attribution-ShareAlike 4.0 International License.
Based on a work at www.timbovee.com.

You must be logged in to post a comment.