3:30 p.m. New York time
Half an hour before the closing bell. The S&P 500 futures reversed at the overnight low, 5809, and rose back into the the 5870s. Elliott Wave Theory: The move is a 4th-wave upward correction within 5th-wave downtrend that began on January 6.
When the correction is complete, a final dowtrending impulse wave will carry the 5th to its end. At that point, the parent 1st wave, which began on December 16 from 6163.75, will also end, and a 2nd-wave upward correction will begin.
9:35 a.m. New York time
What’s happening now? The S&P 500 E-mini futures continued their decline overnight, from the 5860s to slightly above 5800.
What does it mean? Elliott Wave Theory analysis finds that the decline from mid-December’s significant market top continues and is now in its fnal subwave.
The reversal occurred on December 16, 2024 from 6163.75. Note the wave labels at that point on the chart. Six nested 5th waves of increasing degree all came to an end at that moment, and the next tick six tested 1st waves began, subwaves within a 4th-wave downward correction.
This is the season when market pundits display their expectations for the 2025 markets. The chart below displays mine, insofar as the S&P 500 futures continue to reflect the the broader market.
It is a very bearish picture. Not a quick crash and recovery like we saw at the outset of the Covid-19 Pandemic, but a long-lasting downward trend worthy of the monicker “Hard Times”.
But the truth of the markets is that even bearish times have uptrending waves interspersed with the declines. There in lies the beauty of the markets: There is always, ALWAYS, an opportunity to win and equally, an opportunity to lose.
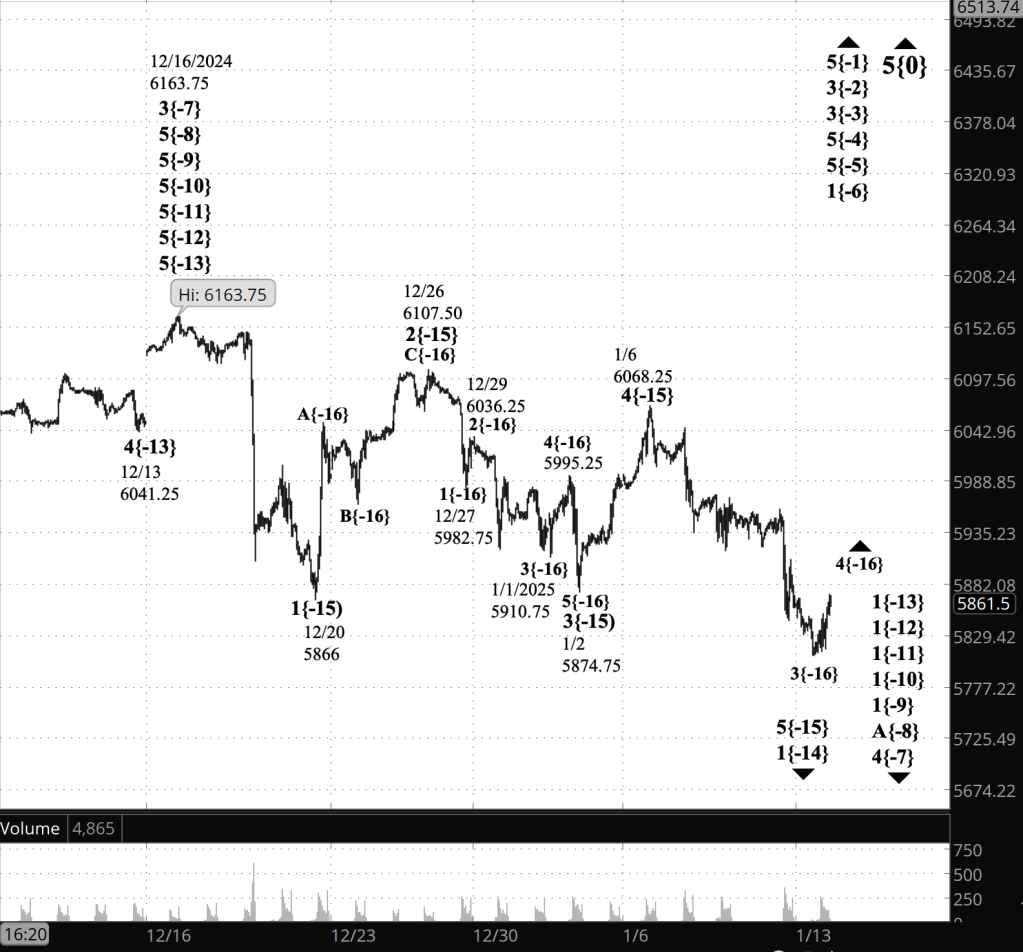
[S&P 500 E-mini futures at 3:30 p.m., 50-minute bars, with volume]
What are the alternatives? None are apparent at this point. They will surely develop, as they always do.
What does Elliott wave theory say? Here are the waves that underly the analyses.
Principal Analysis:
- .Rising wave 5{0} is underway. It is a wave of Intermediate degree that began in December 2018.
- It is in its final subwave, wave 5{-1}.
- Within wave 5{-1}, rising waves 5{-2}, 5{-3} and 5{-4} are underway, as is wave 5{-5}.
- Wave 5{-5} is in its initial subwave, wave 1{-6}, which in turn is in its middle subwave, wave 3{-7}.
- Wave 4{-7} is in its initial; subwave, which is uptrending wave A{-8}, if wave 4{-7} is a Flat structure, with three subwaves, or wave 1{-8} if it is a Zigzag structure, with five subwaves. (I’ll assume Flat as the list continues, since that’s more common within 4th waves)
- Wave A{-8} is in its intial subwave, wave 1{-9}, as are waves 1{-10}, 1{-11}, 1{-12}, 1{-13} and 1{-14}.
- Wave 5{-15} is presently underway and is declining.
Long-term Waves.
These are the waves currently in progress under my principal analysis. Each line on the list shows the wave number, with the subscript in curly brackets, the traditional degree name, the starting date, the starting price of the S&P 500 E-mini futures, and the direction of the wave.
- S&P 500 Index:
- 5{+3} Supercycle, 7/8/1932, 4.40 (up)
- 5{+2} Cycle, 12/9/1974, 60.96 (up)
- 5{+1} Primary, 3/6/2009, 666.79 (up)
- 5{0} Intermediate, 12/26/2018, 2346.58 (up)
- S&P 500 Futures
- 5{-1} Minor, 10/27/2023, 4127.25 (up)
- 3{-2} Minute, 10/27/23, 4127.75 (up)
- 3{-3} Minuette, 10/27/23, 4127.75 (up)
- 5{-4} Subminuette, 4/18/2024, 4963.50 (up)
- 5{-5} Micro, 8/5/2024, 5120 (up)
- 1{-6} Submicro, 8/5/2024, 5120 (up)
- 4{-7} Minuscule, 12/16/2024, 6163.75 (down)
- A{-8} (unnamed), 12/16/2024, 6163.75 (down)
- 1{-9} (unnamed), 12/16/2024, 6163.75 (down)
- 1{-10} (unnamed), 12/16/2024, 6163.75 (down)
- 1{-11} (unnamed), 12/16/2024, 6163.75 (down)
- 1{-12} (unnamed), 12/16/2024, 6163.75 (down)
- 1{-13} (unnamed), 12/16/2024, 6163.75 (down)
- 1{-14} (unnamed), 12/16/2024, 6163.75 (down)
- 5{-15} (unnamed), 1/6/2025, 6068.25 (down)
Reading the chart. Price movements — waves – – in Elliott wave analysis are labeled with numbers within trending waves and letters with corrective waves. The subscripts — numbers in curly brackets — designate the wave’s degree, which, in Elliott wave analysis, means the relative position of a wave within the larger and smaller structures that make up the chart. R.N. Elliott, who in the 1930s developed the form of analysis that bears his name, viewed the chart as a complex structure of smaller waves nested within larger waves, which in turn are nested within still larger waves. In mathematics it’s called a fractal structure, where at every scale the pattern is similar to the others.
Learning and other resources. Elliott wave analysis provides context, not prophecy. As the 20th century semanticist Alfred Korzybski put it in his book Science and Sanity (1933), “The map is not the territory … The only usefulness of a map depends on similarity of structure between the empirical world and the map.” And I would add, in the ever-changing markets, we can judge that similarity of structure only after the fact.
See the menu page Analytical Methods for a rundown on where to go for information on Elliott wave analysis.
By Tim Bovee, Portland, Oregon, January 13, 2025
Disclaimer
Tim Bovee, Private Trader tracks the analysis and trades of a private trader for his own accounts. Nothing in this blog constitutes a recommendation to buy or sell stocks, options or any other financial instrument. The only purpose of this blog is to provide education and entertainment.
No trader is ever 100 percent successful in his or her trades. Trading in the stock and option markets is risky and uncertain. Each trader must make trading decisions for his or her own account, and take responsibility for the consequences.
License
All content on Tim Bovee, Private Trader by Timothy K. Bovee is licensed under a Creative Commons Attribution-ShareAlike 4.0 International License.
Based on a work at www.timbovee.com.

You must be logged in to post a comment.