3:30 p.m. New York time
Half an hour befor the closing bell. The S&P 500 futures worked its way lower during the session.
Elliott Wave Theory: The decline, while small, suggests that Wave A may have ended at the overnight peak, 6017.50, and wave B may have begun. Both are subwaves of the 2nd wave upward correction that began on January 13. I have not changed the map labelling yet but instead wait for more downward movement to confirm the wave B interpretation.
I have updated the wave lists, below, to include the modifications made in the revised analysis.
12:35 p.m. New York time
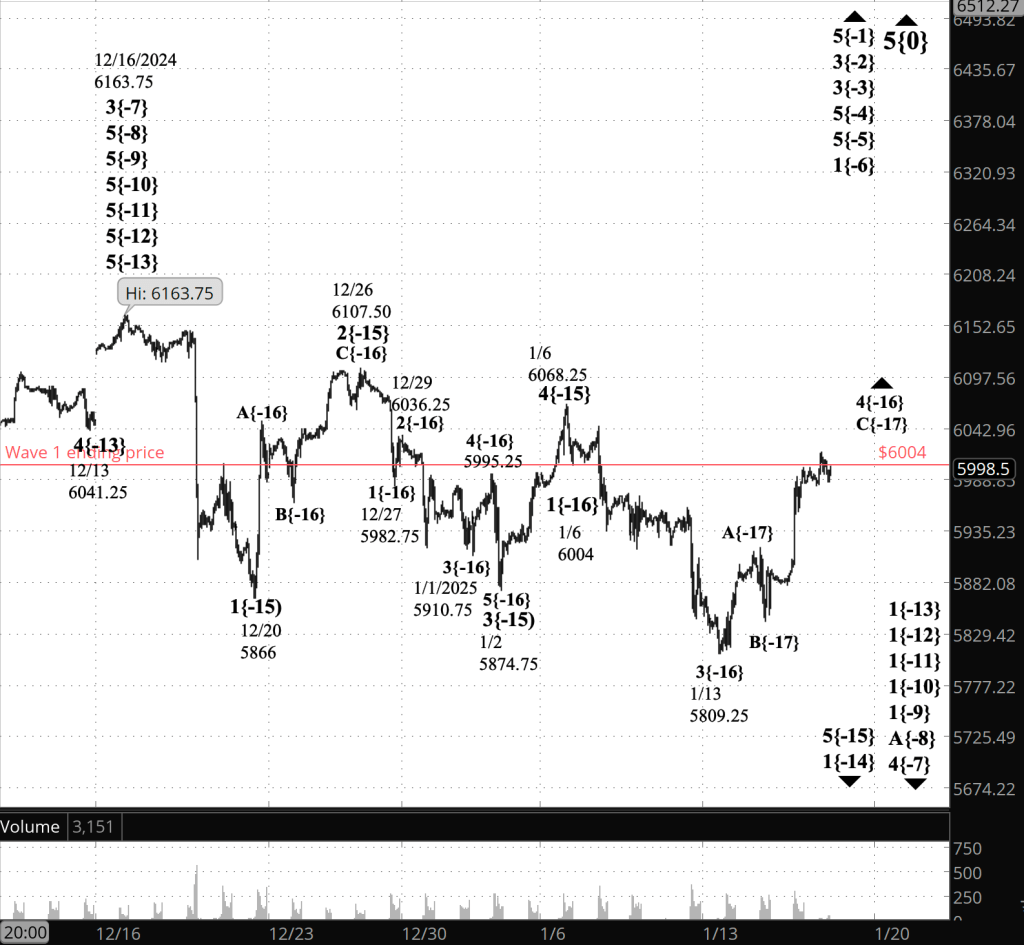
The revised analysis. As noted in this morning’s analysis, the S&P 500 future broke a rule overnight, when the 4th-wave upward correction moved past the end of the previous 1st wave, which is downtrending. In Elliott Wave Analysis that’s forbidden. Any 4th wave that does that isn’t a 4th wave but rather something else.
On the chart, each wave has a number and a subscript in curly brackets showing where the wave stands in relation to Intermediate degree. The current Intermediate wave began in December 2018 and is numbered wave 5{0}.
I went back to the chart and puzzled through the possibilities. Here’s what I came up with.,
- To avoid a 4th-wave breaking the rule, the low of January 13 cannot be the end of a 3rd wave and the start of a 4th wave.
- Although the form of the decline from January 6 to January 13 is a bit messy, it is possible to count its subwaves as being five in number.
- That being the case, the January 13 low becomes the end of wave 1{-14} and the beginning of wave 2{-14}.
- Second waves have a different limit than 4th waves do. A wave 2 can’t move beyond the start of the previoud 1st wave of the same degree. Wave 1{-14} began at 6163 on December 16, 2024.
And the new analysis is done. A 2nd-wave upward correction began on January 13 and is in its initial subwave, wave A.
I’ve retained this morning’s out-dated chart, below, for comparison, and here is the new chart:
[S&P 500 E-mini futures at 3:30 p.m., 55-minute bars, with volume]
9:35 a.m. New York time
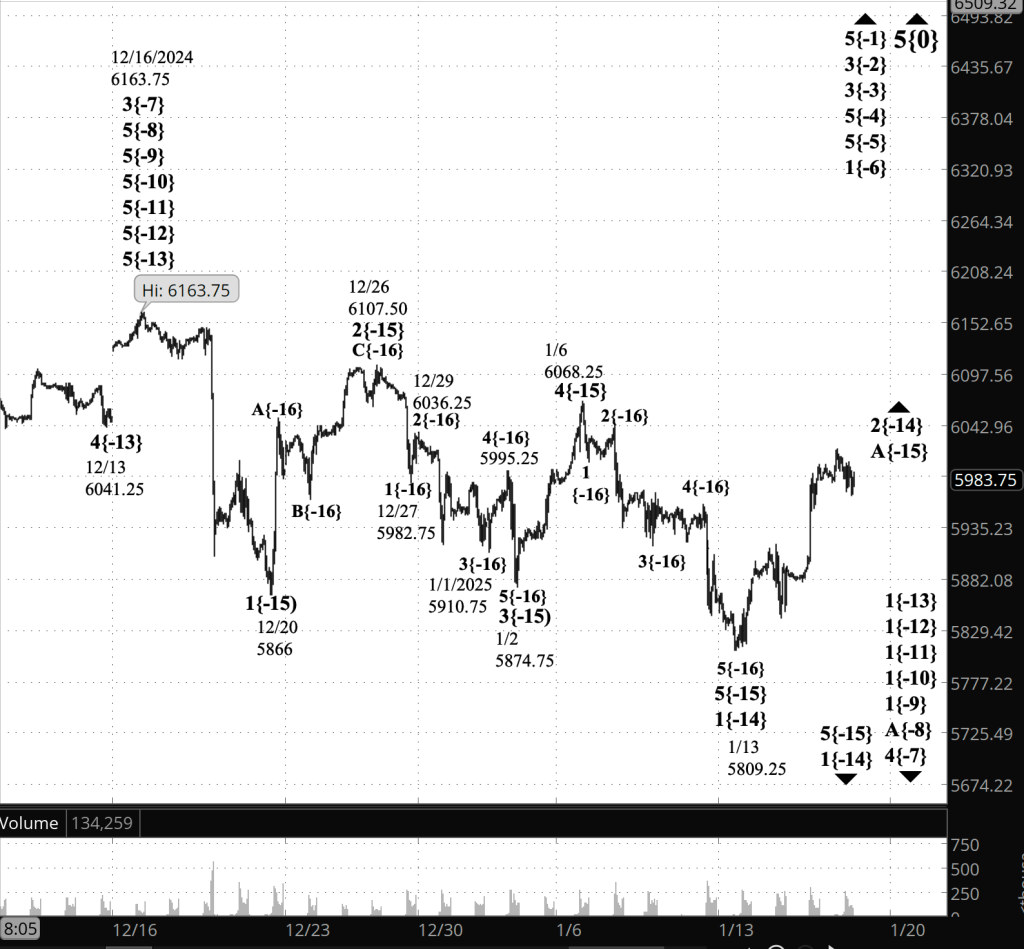
What’s happening now? The S&P 500 E-mini futures rose overnight, from the 5980s to 6017.50 and then, as the opening bell approached, retraced muchof that gain.
What does it mean? The Elliott Wave Theory pattern remans as it was a day ago: The final subwave, wave C, within a 4th-wave upward correction continues. The correction began on January 13 and is a subwave of a downtrending 5th-wave that began on on January 6.
Maybe. A risk I noted in yesterday’s analysis has occurred; Wave 4 has broken an Elliiott Wave rule.
The 4th wave high overnightt, 6017.50, is $13.50 above the end of wave 5’s initial subwave. Wave 1 ended at 6004 on January 6. If a 4th wave moves above the end of the preceding 1st wave of the same degree, it has violated a rule of Elliott Wave Theory.
That means the chart must be re-analyzed. That will be today’s project, and I intend to update the chart as soon as that work is complete.
[Outdated Chart: See revised chart above.]
[S&P 500 E-mini futures at 9:35 a.m., 55-minute bars, with volume]
What are the alternatives? We’re at a wait-and-see moment until the chart re-analysis is complete.
What does Elliott wave theory say? Here are the waves that underly the analyses.
Principal Analysis:
- Rising wave 5{0} is underway. It is a wave of Intermediate degree that began in December 2018.
- It is in its final subwave, wave 5{-1}.
- Within wave 5{-1}, rising waves 5{-2}, 5{-3} and 5{-4} are underway, as is wave 5{-5}.
- Wave 5{-5} is in its initial subwave, wave 1{-6}, which in turn is in its middle subwave, wave 3{-7}.
- Wave 4{-7} is in its initial; subwave, which is uptrending wave A{-8}, if wave 4{-7} is a Flat structure, with three subwaves, or wave 1{-8} if it is a Zigzag structure, with five subwaves. (I’ll assume Flat as the list continues, since that’s more common within 4th waves)
- Wave A{-8} is in its intial subwave, wave 1{-9}, as are waves 1{-10}, 1{-11}, 1{-12}, and 1{-13}.
- Wave 2{-14}, an upward correction and is in its first subwave, wave A{-15}.
Long-term Waves.
These are the waves currently in progress under my principal analysis. Each line on the list shows the wave number, with the subscript in curly brackets, the traditional degree name, the starting date, the starting price of the S&P 500 E-mini futures, and the direction of the wave
- S&P 500 Index:
- 5{+3} Supercycle, 7/8/1932, 4.40 (up)
- 5{+2} Cycle, 12/9/1974, 60.96 (up)
- 5{+1} Primary, 3/6/2009, 666.79 (up)
- 5{0} Intermediate, 12/26/2018, 2346.58 (up)
- S&P 500 Futures
- 5{-1} Minor, 10/27/2023, 4127.25 (up)
- 3{-2} Minute, 10/27/23, 4127.75 (up)
- 3{-3} Minuette, 10/27/23, 4127.75 (up)
- 5{-4} Subminuette, 4/18/2024, 4963.50 (up)
- 5{-5} Micro, 8/5/2024, 5120 (up)
- 1{-6} Submicro, 8/5/2024, 5120 (up)
- 4{-7} Minuscule, 12/16/2024, 6163.75 (down)
- A{-8} (unnamed), 12/16/2024, 6163.75 (down)
- 1{-9} (unnamed), 12/16/2024, 6163.75 (down)
- 1{-10} (unnamed), 12/16/2024, 6163.75 (down)
- 1{-11} (unnamed), 12/16/2024, 6163.75 (down)
- 1{-12} (unnamed), 12/16/2024, 6163.75 (down)
- 1{-13} (unnamed), 12/16/2024, 6163.75 (down)
- 2{-14} (unnamed), 1/13/2025, 5809.25 (up)
- A{-15} (unnamed), 1/13/2025, 5809.25 (up)
Reading the chart. Price movements — waves – – in Elliott wave analysis are labeled with numbers within trending waves and letters with corrective waves. The subscripts — numbers in curly brackets — designate the wave’s degree, which, in Elliott wave analysis, means the relative position of a wave within the larger and smaller structures that make up the chart. R.N. Elliott, who in the 1930s developed the form of analysis that bears his name, viewed the chart as a complex structure of smaller waves nested within larger waves, which in turn are nested within still larger waves. In mathematics it’s called a fractal structure, where at every scale the pattern is similar to the others.
Learning and other resources. Elliott wave analysis provides context, not prophecy. As the 20th century semanticist Alfred Korzybski put it in his book Science and Sanity (1933), “The map is not the territory … The only usefulness of a map depends on similarity of structure between the empirical world and the map.” And I would add, in the ever-changing markets, we can judge that similarity of structure only after the fact.
See the menu page Analytical Methods for a rundown on where to go for information on Elliott wave analysis.
By Tim Bovee, Portland, Oregon, January 16, 2025
Disclaimer
Tim Bovee, Private Trader tracks the analysis and trades of a private trader for his own accounts. Nothing in this blog constitutes a recommendation to buy or sell stocks, options or any other financial instrument. The only purpose of this blog is to provide education and entertainment.
No trader is ever 100 percent successful in his or her trades. Trading in the stock and option markets is risky and uncertain. Each trader must make trading decisions for his or her own account, and take responsibility for the consequences.
License
All content on Tim Bovee, Private Trader by Timothy K. Bovee is licensed under a Creative Commons Attribution-ShareAlike 4.0 International License.
Based on a work at www.timbovee.com.

You must be logged in to post a comment.