3:30 p.m. New York time
Half an hour before the closing bell. The S&P 500 futures reahed a peak of 6162.25 during the session and then declined, so far into the 6120s.
In terms of Elliott Wave Theory, the pattern is ambiguous. The A-wave within an upward correction, wave 4, has been in its end game for more than a week. Was the peak the end of wave A, and the decline the initial decline of wave B? Time will tell. Given the ambiguity, I’ve marked both possibilities on the chart.
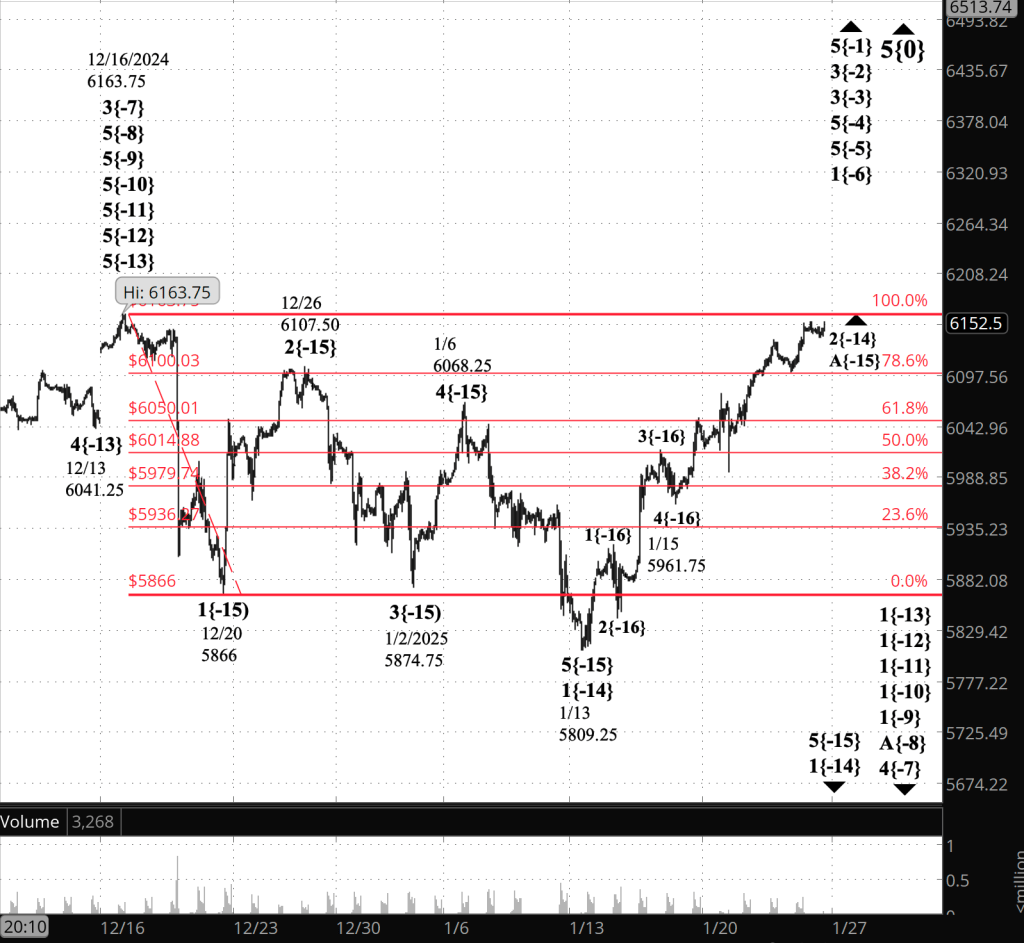
12:38 p.m. New York time
A new analysis. The S&P500 index, in a rising wave that began on January 15, has broken above the peak set on December 6. The S&P 500 futures are close but haven’t yet crossed the line.
The index was believed to be a 2nd wave, and when it broke above the starting point of wave 1, it forced the following reanalysis:
- The rise that began on January 15 is an uptrending 4th-wave correction, which is allowed under the rules to break above the preceding 1st wave.
- The futures remained $1.50 below breakout. In this case, I’m going with the index as being correct.
- To eliminate the rule-breaking 2nd wave., I had to move the last three subwaves of the large 1st wave that began decline, down one degree in the fractal structure of the chart, and the same with the rise that followed.
- By doing that, the low point became the end of wave 3 and the following rise, the start of wave 4.
Observation: I’ve learned trough difficult experience that the placement of a subwave in the fracture structure of a wave early in its journey is a guess. The reason: There are fewer waves to give it contrext.
Anyhow, I’m closing now with this. Put in a new chart with the new wave labels, showing the reanalysis. I’ve retained this morning’s chart, with the prior analysis, for comparison. I shall update wave lists below in time for the closing post tis afternoon.
[S&P 500 E-mini futures at 3:30 p.m., hourly bars, with volume]
11:30 a.m. New York time
Elliott Wave Theory rule broken. Corrected version: The S&P 500 index has broken a rule of Elliott Wave Theory. The 2nd wave upward correction that began on January 6 has risen beyond that level. The S&P 500 E-mini futures remain $1.50 below the breakout level.
As noted this morning, the S&P 500 futures are derivative of the index. When there’ a difference between the two, the index tend to be correct.
The Elliott Wave Theory ruled says that a 2nd wave never moves beyond the start of the preceding 1st wave. It has moved beyond that point. Time to re-analyze the chart.
New analysis, new chart, new waves lists, coming soon.
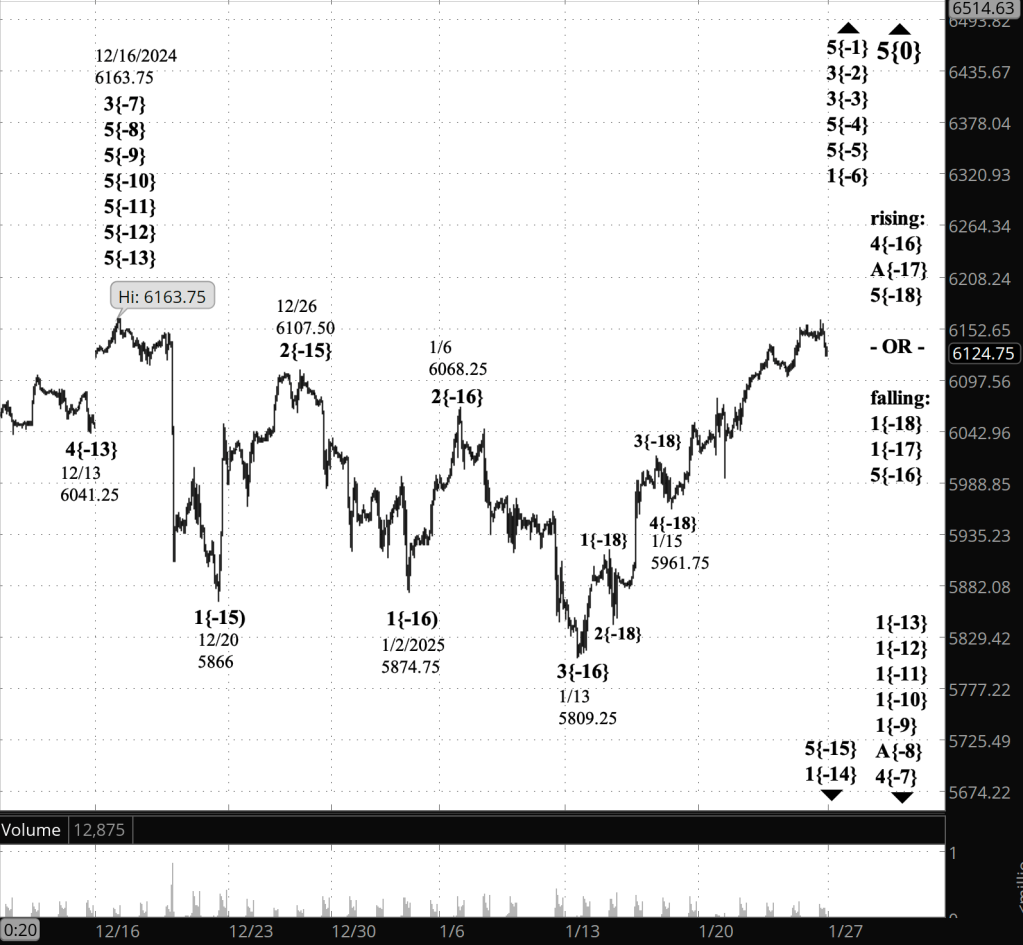
9:35 a.m. New York time
What’s happening now? The S&P 500 E-mini futures continued to rise overnight, coming ever closer the peak, 6163.75, attained on December 16.
What does it mean? In terms of Elliott Wave Theory, that peak was a major turning point, ending a nested series of increasingly larger 5th waves and beginning a series of declining 1st waves.
Within the smaller 1st wave that I’m tracking in my analysis, a 2nd-wave upward correction is underway. The preceding 1st wave began from the December 16 peak.
And this is where things get interesting. Elliott Wave Theory has rules, intended to let the analyst know when the chart no longer matches the analysis. We are approaching one of those triggering of a rule now. We’ve come very close, to within $7.75, to the trigger point.
The rule says that a 2nd wave can’t move beyond the start of the 1st wave. If it does, then what the analysis labels as a 2nd wave isn’t a 2nd wave but is something else. Essentially, all of the analysis since January 13, the start of wave 2, gets tossed, and possibly all of the analysis since the peak.
Wave 2 is in its first subwave, wave A, and has two more subwaves to go after wave A s complete.
Adding to the complication, the S&P 500 E-mini futures move in 25-cent increments. It is based on the S&P 500 index, which moves in increments of one cent. So it’s possible that the 2nd wave in the futures would break the rule but the index would not. Which is fairly illogical.
My practice has been to give priority to the index, and to not do a massve reworking of the analysis until the rule is broken by the index as well as by the futures.
Bottom line: Interesting days on the chart may lie ahead.
What might a new analysis look like? Just guessing at the moment, but I think the low of January 13 is the key. If that is the end of wave 3 rather than wave 5, as the chart now has it, then then the upward move that followed is a 4th wave. And 4th waves break no rule by moving beyond the start of the preceding 1st wave.
[S&P 500 E-mini futures at 9:35 a.m., hourly bars, with volume]
[Invalidated with today’s reanalysis. See current charts higher up.]
What are the alternatives? Wave 4 or wave 5., see above in the closing analysis.
What does Elliott wave theory say? Here are the waves that underly the analyses, updated with the today’s reanalysis.
Principal Analysis:
- Rising wave 5{0} is underway. It is a wave of Intermediate degree that began in December 2018.
- It is in its final subwave, wave 5{-1}.
- Within wave 5{-1}, rising waves 5{-2}, 5{-3} and 5{-4} are underway, as is wave 5{-5}.
- Wave 5{-5} is in its initial subwave, wave 1{-6}, which in turn is in its middle subwave, wave 3{-7}.
- Wave 4{-7} is in its initial; subwave, which is uptrending wave A{-8}, if wave 4{-7} is a Flat structure, with three subwaves, or wave 1{-8} if it is a Zigzag structure, with five subwaves. (I’ll assume Flat as the list continues, since that’s more common within 4th waves)
- Wave A{-8} is in its initial subwave, wave 1{-9}, as are waves 1{-10}, 1{-11}, 1{-12}, and 1{-13}.
- Wave 1{-14}, an upward correction and is in its first subwave, wave 3{-15}.
- Wave 3{-15] is in its second subwave, rising wave 4{-16}.
Long-term Waves.
These are the waves currently in progress under my principal analysis. Each line on the list shows the wave number, with the subscript in curly brackets, the traditional degree name, the starting date, the starting price of the S&P 500 E-mini futures, and the direction of the wave. (Updated with today’s reanalysis.)
- S&P 500 Index:
- 5{+3} Supercycle, 7/8/1932, 4.40 (up)
- 5{+2} Cycle, 12/9/1974, 60.96 (up)
- 5{+1} Primary, 3/6/2009, 666.79 (up)
- 5{0} Intermediate, 12/26/2018, 2346.58 (up)
- S&P 500 Futures
- 5{-1} Minor, 10/27/2023, 4127.25 (up)
- 3{-2} Minute, 10/27/23, 4127.75 (up)
- 3{-3} Minuette, 10/27/23, 4127.75 (up)
- 5{-4} Subminuette, 4/18/2024, 4963.50 (up)
- 5{-5} Micro, 8/5/2024, 5120 (up)
- 1{-6} Submicro, 8/5/2024, 5120 (up)
- 4{-7} Minuscule, 12/16/2024, 6163.75 (down)
- A{-8} (unnamed), 12/16/2024, 6163.75 (down)
- 1{-9} (unnamed), 12/16/2024, 6163.75 (down)
- 1{-10} (unnamed), 12/16/2024, 6163.75 (down)
- 1{-11} (unnamed), 12/16/2024, 6163.75 (down)
- 1{-12} (unnamed), 12/16/2024, 6163.75 (down)
- 1{-13} (unnamed), 12/16/2024, 6163.75 (down)
- 1{-14} (unnamed), 1/13/2025, 5809.25 (down)
- 3{-15} (unnamed), 1/13/2025, 5809.25 (down)
- 4{-16} (unnamed), 1/13/2025, 5809.25 (up)
Reading the chart. Price movements — waves – – in Elliott wave analysis are labeled with numbers within trending waves and letters with corrective waves. The subscripts — numbers in curly brackets — designate the wave’s degree, which, in Elliott wave analysis, means the relative position of a wave within the larger and smaller structures that make up the chart. R.N. Elliott, who in the 1930s developed the form of analysis that bears his name, viewed the chart as a complex structure of smaller waves nested within larger waves, which in turn are nested within still larger waves. In mathematics it’s called a fractal structure, where at every scale the pattern is similar to the others.
Learning and other resources. Elliott wave analysis provides context, not prophecy. As the 20th century semanticist Alfred Korzybski put it in his book Science and Sanity (1933), “The map is not the territory … The only usefulness of a map depends on similarity of structure between the empirical world and the map.” And I would add, in the ever-changing markets, we can judge that similarity of structure only after the fact.
See the menu page Analytical Methods for a rundown on where to go for information on Elliott wave analysis.
By Tim Bovee, Portland, Oregon, January 24, 2025
Disclaimer
Tim Bovee, Private Trader tracks the analysis and trades of a private trader for his own accounts. Nothing in this blog constitutes a recommendation to buy or sell stocks, options or any other financial instrument. The only purpose of this blog is to provide education and entertainment.
No trader is ever 100 percent successful in his or her trades. Trading in the stock and option markets is risky and uncertain. Each trader must make trading decisions for his or her own account, and take responsibility for the consequences.
All content on Tim Bovee, Private Trader by Timothy K. Bovee is licensed under a Creative Commons Attribution-ShareAlike 4.0 International License.
Based on a work at www.timbovee.com.

You must be logged in to post a comment.