3:30 p.m. New York time
Half an hour before the closing bell. The S&P 500 futures rose during the session, coming close to the overnight high, 6069.
This morning’s Elliott Wave Theory analysis saw high as the beginning a the final wave of a small downward correction. That correction is a declining C wave, so why is the price rising?
That small C wave — C{-19} on the chart — has the usual ups and downs of any price movement. Wave C{-19} will have three subwaves. The overnight decline was the first subwave, wave A{-20}. The session rise is the second subwave, wave B{-20}. A declining final subwave, wave C{-20}, comes next.
Can a C wave move above the prior B-wave’s end point? There’s not a rule against it in the theory. So unless it was a huge rise above, I’ll treat in the analysis as normal.
9:35 a.m. New York time
What’s happening now? The S&P 500 E-mini futures hit 6069 in the minute before the closing bell sounded and then began to drop, so far reaching 5987 during the overnight session
What does it mean? The Elliott Wave Theory analysis of the chart shows the same tangle of corrections now underway, each a different degree from the others.
To try to gain some clarity, I shall discuss the layout of the fractal tangle using the full labelling that I use on the chart: A wave number followed by a subscript in brackets showng the distance of the wave’s degree from the Intermediate degree, which began in December 2018.
Each day’s chart tends to have a big question demanding an answer. Today’s question is whether wave B{-19} ended at the end-of-session peak — 6069 — and wave C{-19} begin, or is B{-19} still underwqy. The waves at the {-19} level when the fractal structure are subwaves of wave C{-18}, a declining wave with wave {B-17}, also declining. All of the corrections are happening with wave 4{-16}, an upward correction that began on June 13.
The answer to the question, has wave C{-19} begun, depends in part on the nature of the {-19}-level correction. Most commonly, corrections come in two varieties, a ZigZag or a Flat. If it’s a ZigZag, wave A{-19} has five subwaves. If a Flat, then three subwaves.
Wave A{-19} was a powerful downward movement, and such movements often look like a straight line on the chart. Shrink the bars on the chart enough, however, and the pattern becomes clear: The A-wave has five subwaves, making it a ZigZag.
A B-wave in a ZigZag, according to an Elliott Wave Theory rule, never moves beyond the starting point of wave A. In a Flat, it must retrace 90% or more of wave A.
Wave B{-19} on this chart has completed three waves and is well short of a 90% retracement, and so its possible that wave B ended at the end of yesterday’s session, at 6069. And I’ve marked the chart to conform.
It’s not 100% certain. The price could reverse and rise to the 90% retracement mark. Nonetheless, the analysis is consistent with the chart.
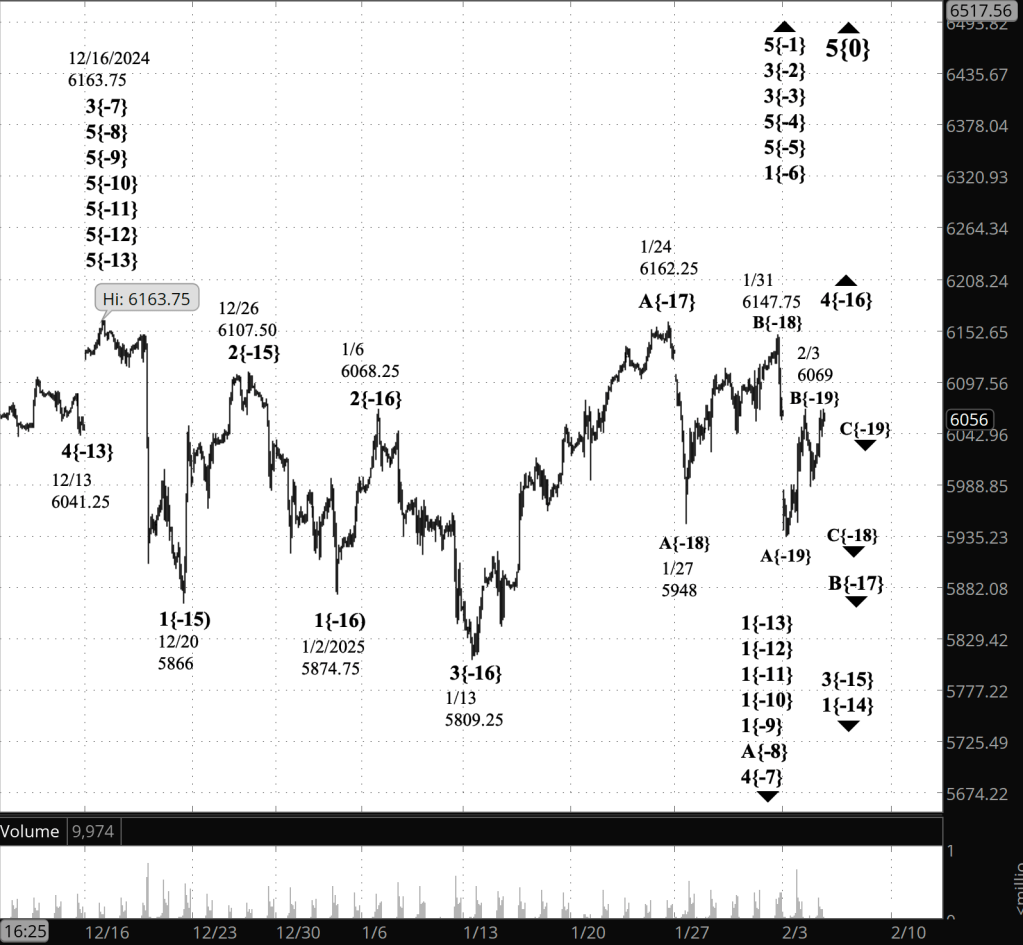
[S&P 500 E-mini futures at 3:30 p.m., 85-minute bars, with volume]
What are the alternatives? See above.
What does Elliott wave theory say? Here are the waves that underly the analyses, updated with the today’s reanalysis.
Principal Analysis:
- Rising wave 5{0} is underway. It is a wave of Intermediate degree that began in December 2018.
- It is in its final subwave, wave 5{-1}.
- Within wave 5{-1}, rising waves 5{-2}, 5{-3} and 5{-4} are underway, as is wave 5{-5}.
- Wave 5{-5} is in its initial subwave, wave 1{-6}, which in turn is in its middle subwave, wave 3{-7}.
- Wave 4{-7} is in its initial; subwave, which is uptrending wave A{-8}, if wave 4{-7} is a Flat structure, with three subwaves, or wave 1{-8} if it is a Zigzag structure, with five subwaves. (I’ll assume Flat as the list continues, since that’s more common within 4th waves)
- Wave A{-8} is in its initial subwave, wave 1{-9}, as are waves 1{-10}, 1{-11}, 1{-12}, and 1{-13}.
- Wave 1{-14}, an upward correction and is in its first subwave, wave 3{-15}.
- Wave 3{-15] is in its second subwave, rising wave 4{-16}, an upward correction
- Wave 4{-16} is in its middle subwave, descendng wave B{-17}, which is in its middle subwave, rising wave B{-18}
Long-term Waves.
These are the waves currently in progress under my principal analysis. Each line on the list shows the wave number, with the subscript in curly brackets, the traditional degree name, the starting date, the starting price of the S&P 500 E-mini futures, and the direction of the wave. (Updated with today’s reanalysis.)
- S&P 500 Index:
- 5{+3} Supercycle, 7/8/1932, 4.40 (up)
- 5{+2} Cycle, 12/9/1974, 60.96 (up)
- 5{+1} Primary, 3/6/2009, 666.79 (up)
- 5{0} Intermediate, 12/26/2018, 2346.58 (up)
- S&P 500 Futures
- 5{-1} Minor, 10/27/2023, 4127.25 (up)
- 3{-2} Minute, 10/27/23, 4127.75 (up)
- 3{-3} Minuette, 10/27/23, 4127.75 (up)
- 5{-4} Subminuette, 4/18/2024, 4963.50 (up)
- 5{-5} Micro, 8/5/2024, 5120 (up)
- 1{-6} Submicro, 8/5/2024, 5120 (up)
- 4{-7} Minuscule, 12/16/2024, 6163.75 (down)
- A{-8} (unnamed), 12/16/2024, 6163.75 (down)
- 1{-9} (unnamed), 12/16/2024, 6163.75 (down)
- 1{-10} (unnamed), 12/16/2024, 6163.75 (down)
- 1{-11} (unnamed), 12/16/2024, 6163.75 (down)
- 1{-12} (unnamed), 12/16/2024, 6163.75 (down)
- 1{-13} (unnamed), 12/16/2024, 6163.75 (down)
- 1{-14} (unnamed), 1/13/2025, 5809.25 (down)
- 3{-15} (unnamed), 1/13/2025, 5809.25 (down)
- 4{-16} (unnamed), 1/13/2025, 5809.25 (up)
- B{-17} (unnamed), 1/24/2025, 6162.25 (down)
- C{-18} (unnamed), 1/31/2025, 6147.75 (down)
- B{-18} (unnamed), 1/27/2025, 5948 (up)
Reading the chart. Price movements — waves – – in Elliott wave analysis are labeled with numbers within trending waves and letters with corrective waves. The subscripts — numbers in curly brackets — designate the wave’s degree, which, in Elliott wave analysis, means the relative position of a wave within the larger and smaller structures that make up the chart. R.N. Elliott, who in the 1930s developed the form of analysis that bears his name, viewed the chart as a complex structure of smaller waves nested within larger waves, which in turn are nested within still larger waves. In mathematics it’s called a fractal structure, where at every scale the pattern is similar to the others.
Learning and other resources. Elliott wave analysis provides context, not prophecy. As the 20th century semanticist Alfred Korzybski put it in his book Science and Sanity (1933), “The map is not the territory … The only usefulness of a map depends on similarity of structure between the empirical world and the map.” And I would add, in the ever-changing markets, we can judge that similarity of structure only after the fact.
See the menu page Analytical Methods for a rundown on where to go for information on Elliott wave analysis.
By Tim Bovee, Portland, Oregon, February 4, 2025
Disclaimer
Tim Bovee, Private Trader tracks the analysis and trades of a private trader for his own accounts. Nothing in this blog constitutes a recommendation to buy or sell stocks, options or any other financial instrument. The only purpose of this blog is to provide education and entertainment.
No trader is ever 100 percent successful in his or her trades. Trading in the stock and option markets is risky and uncertain. Each trader must make trading decisions for his or her own account, and take responsibility for the consequences.
All content on Tim Bovee, Private Trader by Timothy K. Bovee is licensed under a Creative Commons Attribution-ShareAlike 4.0 International License.
Based on a work at www.timbovee.com.

You must be logged in to post a comment.