3:30 p.m. New York time
Half an hour before the closing bell. The S&P 500 futures rose during the session, pausing at 3080, the 38.2% Fibonacci retracement level. It’s as though this morning’s drama with the higher than expected inflation report became a distant, not so fond memory before the session intended.
Elliott Wave Theory: And where are we now? About where we were before the inflation report. The 38.2% retracement level was where the price was stuck before the inflation announcement, and 38.2 is where it is as the closing bell approaches.
A small declining 3rd wave with a larger declining C wave within a still larger falling B wave within a 4th-wave upward correction that began on January 13 continues.
9:35 a.m. New York time
What’s happening now? The S&P 500 E-mini futures dropped 65 points in a minuter after the Bureau of Labor Statistics announced that inflation was worse that expected in January, from 6098 down to 6093.50. It then worked its way lower over the next few minutes to the 6020s.
What does it mean? The decline, as viewed through the lens of Elliott Wave Theory, was the expected resumption of the decline of the 3rd wave that began on February 7. The 3rd wave is the middle subwave with a declining C wave that began on January 31.
The C wave, when complete, will be the end of the larger declining B wave that began on January 24.
The waves on the chart have numbers and letters, each followed by a subsvript in curly brackets that shows how many degrees the wave is, within the fractal structure of the chart, from Intermediate degree. The present Intermediate degree, wave 5{0}, began in December 2018. On this chart, the waves are all smaller than Intermediate degree, so the numbers in brackets are negative.
The 3rd wave that fell sharply overnight is wave 3{-19} within declining wave C{-18}. Both are within wave B{-17}, the middle subwave of an upward correction that began on January 11, wave 4{-16}.
The decline carried the price down to the 61.8% Fibnacci retracement of the preceding A{-17} wave, typically a stopping point and sometimes a reversal point. The Fibonacci retracement ladder is shown on the chart in red.
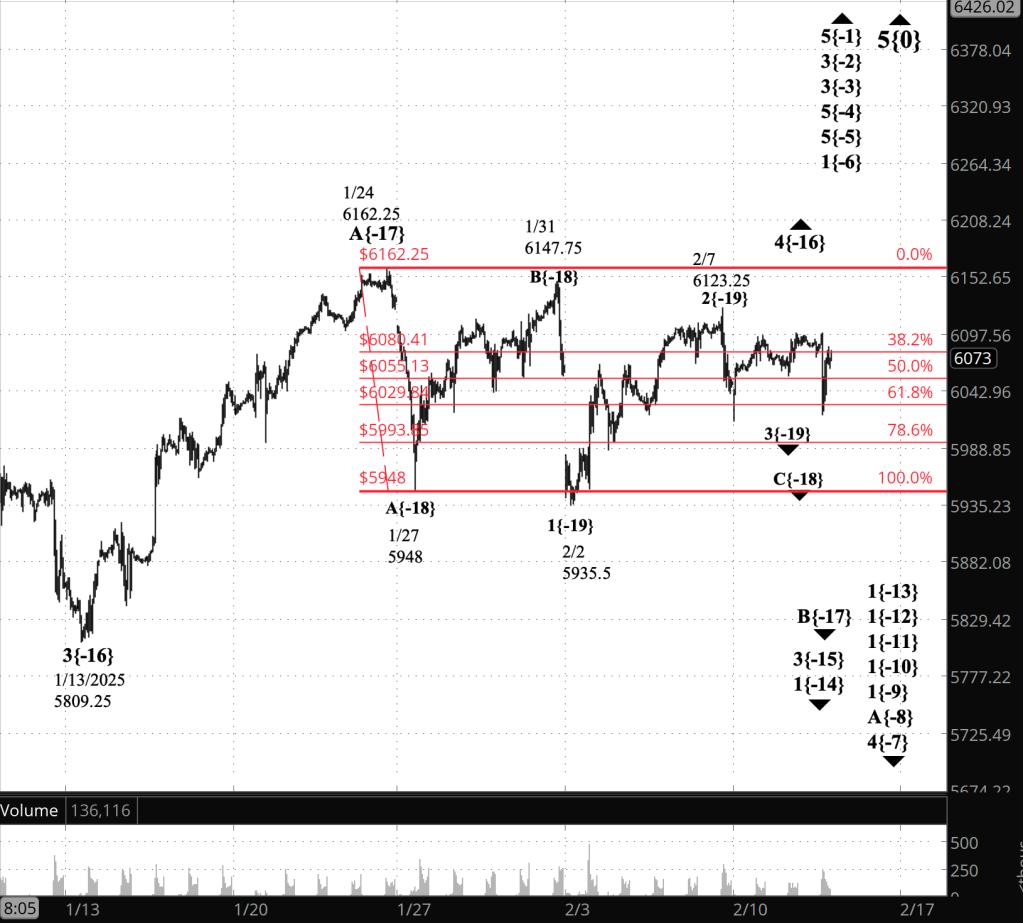
[S&P 500 E-mini futures at 3:30 p.m., 55-minute bars, with volume]
What are the alternatives? The ambiguity has not been resolved. Should the 1st-wave endpoint, wave 1{-19}, on February 2 instead be labeled as the parent wave C{-18} endpoint, bringing to an end the B{-17} wave that is one degree higher in the fractal chain of the chart and the beginning of a rising wave C{-17wave. All of this is happening within the wave 4{-16} upward correction that began on January 13. The rising C wave, if it is in fact underway, the final subwave of that correction.
If the price moves above 6123.25, the high of rising wave 2{-19} in the principal analysis, then I would switch to an alternative scenario: Wave B ended on February 2. The price showed a sharp decline today without having moved above 6123.25, so by that criterion a re-analysis hasn’t been triggered.
What does Elliott wave theory say? Here are the waves that underlie the analyses.
Principal Analysis:
- Rising wave 5{0} is underway. It is a wave of Intermediate degree that began in December 2018.
- It is in its final subwave, wave 5{-1}.
- Within wave 5{-1}, rising waves 5{-2}, 5{-3} and 5{-4} are underway, as is wave 5{-5}.
- Wave 5{-5} is in its initial subwave, wave 1{-6}, which in turn is in its middle subwave, wave 3{-7}.
- Wave 4{-7} is in its initial subwave, which is uptrending wave A{-8}, if wave 4{-7} is a Flat structure, with three subwaves, or wave 1{-8} if it is a Zigzag structure, with five subwaves. (I’ll assume Flat as the list continues, since that’s more common within 4th waves)
- Wave A{-8} is in its initial subwave, wave 1{-9}, as are waves 1{-10}, 1{-11}, 1{-12}, and 1{-13}.
- Wave 1{-14}, an upward correction and is in its first subwave, wave 3{-15}.
- Wave 3{-15} is in its second subwave, rising wave 4{-16}, an upward correction
- Wave 4{-16} is in its middle subwave, descending wave B{-17}, which is in its middle subwave, rising wave B{-18}
- Declining wave C{-19}, the final subwave of wave B{-18}, has begun.
Long-term Waves.
These are the waves currently in progress under my principal analysis. Each line on the list shows the wave number, with the subscript in curly brackets, the traditional degree name, the starting date, the starting price of the S&P 500 E-mini futures, and the direction of the wave. (Updated with today’s reanalysis.)
- S&P 500 Index:
- 5{+3} Supercycle, 7/8/1932, 4.40 (up)
- 5{+2} Cycle, 12/9/1974, 60.96 (up)
- 5{+1} Primary, 3/6/2009, 666.79 (up)
- 5{0} Intermediate, 12/26/2018, 2346.58 (up)
- S&P 500 Futures
- 5{-1} Minor, 10/27/2023, 4127.25 (up)
- 3{-2} Minute, 10/27/23, 4127.75 (up)
- 3{-3} Minuette, 10/27/23, 4127.75 (up)
- 5{-4} Subminuette, 4/18/2024, 4963.50 (up)
- 5{-5} Micro, 8/5/2024, 5120 (up)
- 1{-6} Submicro, 8/5/2024, 5120 (up)
- 4{-7} Minuscule, 12/16/2024, 6163.75 (down)
- A{-8} (unnamed), 12/16/2024, 6163.75 (down)
- 1{-9} (unnamed), 12/16/2024, 6163.75 (down)
- 1{-10} (unnamed), 12/16/2024, 6163.75 (down)
- 1{-11} (unnamed), 12/16/2024, 6163.75 (down)
- 1{-12} (unnamed), 12/16/2024, 6163.75 (down)
- 1{-13} (unnamed), 12/16/2024, 6163.75 (down)
- 1{-14} (unnamed), 1/13/2025, 5809.25 (down)
- 3{-15} (unnamed), 1/13/2025, 5809.25 (down)
- 4{-16} (unnamed), 1/13/2025, 5809.25 (up)
- B{-17} (unnamed), 1/24/2025, 6162.25 (down)
- C{-18} (unnamed), 1/31/2025, 6147.75 (down)
- B{-18} (unnamed), 1/27/2025, 5948 (up)
- C{-19} (unnamed), 2/7/2025, 5935.5 (down)
Reading the chart. Price movements — waves – – in Elliott wave analysis are labeled with numbers within trending waves and letters with corrective waves. The subscripts — numbers in curly brackets — designate the wave’s degree, which, in Elliott wave analysis, means the relative position of a wave within the larger and smaller structures that make up the chart. R.N. Elliott, who in the 1930s developed the form of analysis that bears his name, viewed the chart as a complex structure of smaller waves nested within larger waves, which in turn are nested within still larger waves. In mathematics it’s called a fractal structure, where at every scale the pattern is similar to the others.
Learning and other resources. Elliott wave analysis provides context, not prophecy. As the 20th century semanticist Alfred Korzybski put it in his book Science and Sanity (1933), “The map is not the territory … The only usefulness of a map depends on similarity of structure between the empirical world and the map.” And I would add, in the ever-changing markets, we can judge that similarity of structure only after the fact.
See the menu page Analytical Methods for a rundown on where to go for information on Elliott wave analysis.
By Tim Bovee, Portland, Oregon, February 12, 2025
Disclaimer
Tim Bovee, Private Trader tracks the analysis and trades of a private trader for his own accounts. Nothing in this blog constitutes a recommendation to buy or sell stocks, options or any other financial instrument. The only purpose of this blog is to provide education and entertainment.
No trader is ever 100 percent successful in his or her trades. Trading in the stock and option markets is risky and uncertain. Each trader must make trading decisions for his or her own account, and take responsibility for the consequences.
All content on Tim Bovee, Private Trader by Timothy K. Bovee is licensed under a Creative Commons Attribution-ShareAlike 4.0 International License.
Based on a work at www.timbovee.com

You must be logged in to post a comment.