3:30 p.m. New York time
Half an hour before the closing bell. The S&P 500 fell during the session, so far reaching a bit below 6120.
The decline at this point appears to be a subwave within rising wave 3, which began on February 12 from 6020.75. Wave 3 is in turn a subwave of a rising C wave, the final wave of a 4th-wave upward correction that began on January 13.
9:35 a.m. New York time
What’s happening now? The S&P 500 E-mini futures rose after trading resumed overnight, from 6137 into the 6150s. Minutes before the opening bell, the price dropped sharply into the 6130s.
What does it mean? Elliott Wave Theory: The 4th-wave upward correction continues, as has been the case since it began on January 13. Within that rise, however, things have changed.
A revision of the chart.
Regular readers will recall that a week ago, in the January 11 edition of Trader’s Notebook, I spotted an ambiguity in the count. I described it this way: “Should the 1st-wave endpoint on February 2 instead be labeled as the parent C-wave endpoint, bringing to an end the B wave that is one degree higher in the fractal chain of the chart and the beginning of a rising C wave.”
Subsequent price movements left the ambiguity unresolved. However, the labeling increasingly put the chart out of balance, with waves of the same degree becoming disproportional to each other.
Over the weekend, I dived into the chart, and decided it was time to change the labelling. The alternative analysis had become more likely than the principal analysis. Today’s chart is the product of that renumbering.
The wave labelling system
In this discussion I’ll refer to waves the way they are labelled on the chart: A wave number followed by a subscript in curly brackets show how many degrees from Intermediate Degree within the fractal structure of the chart that particular wave stands. For example, the upward correction is wave 4{-16}, which is 16 degrees lower than Intermediate. A wave larger than Intermediate will have a positive number in the brackets.
The new analysis
The present Intermediate wave is rising wave 5{0}. It began on December 26, 2018 from 2346.58 on the S&P 500 futures. All of the changes are at a relatively small level, within rising wave 4{-16}.
Here’s what has changed. The locations and dates are the endpoints of the waves.
- Wave 1{-19} to wave C{-18}, on February 2 at 5948.
- That change means that the parent wave, falling wave B{-17}, ended at that point and rising wave C{-17} began.
- The subwaves within the rise that began on February 2 have been raised by one degree, from {-19} to {-18}.
That means that the waves now underway are, from smaller to larger, rising wave 3{-18} within rising wave C{-17} within rising wave 4{-16}.
These changes restore proportionality to the chart and highlight the upward movement as the key directional characteristic at present.
What next? When wave C{-17} is complete, it will also be the end of the upward correction, wave 4{-16}, and the beginning of falling wave 5{-16}. The parent wave, falling wave 3{-15}, began on December 26, 2024, from 6107.50.
Fifth waves generally fall below the end of the preceding 3rd wave — wave 3{-16} at this point. If that’s the case here, then we can expect wave 5{-16} to drop below 5809.25. Some 5th waves are truncated and remain above the end of the preceding 3rd wave.
However far it drops, the end of wave 5{-16} will be the end of wave 3{-15} and the beginning of a large upward correction, wave 4{-15}.
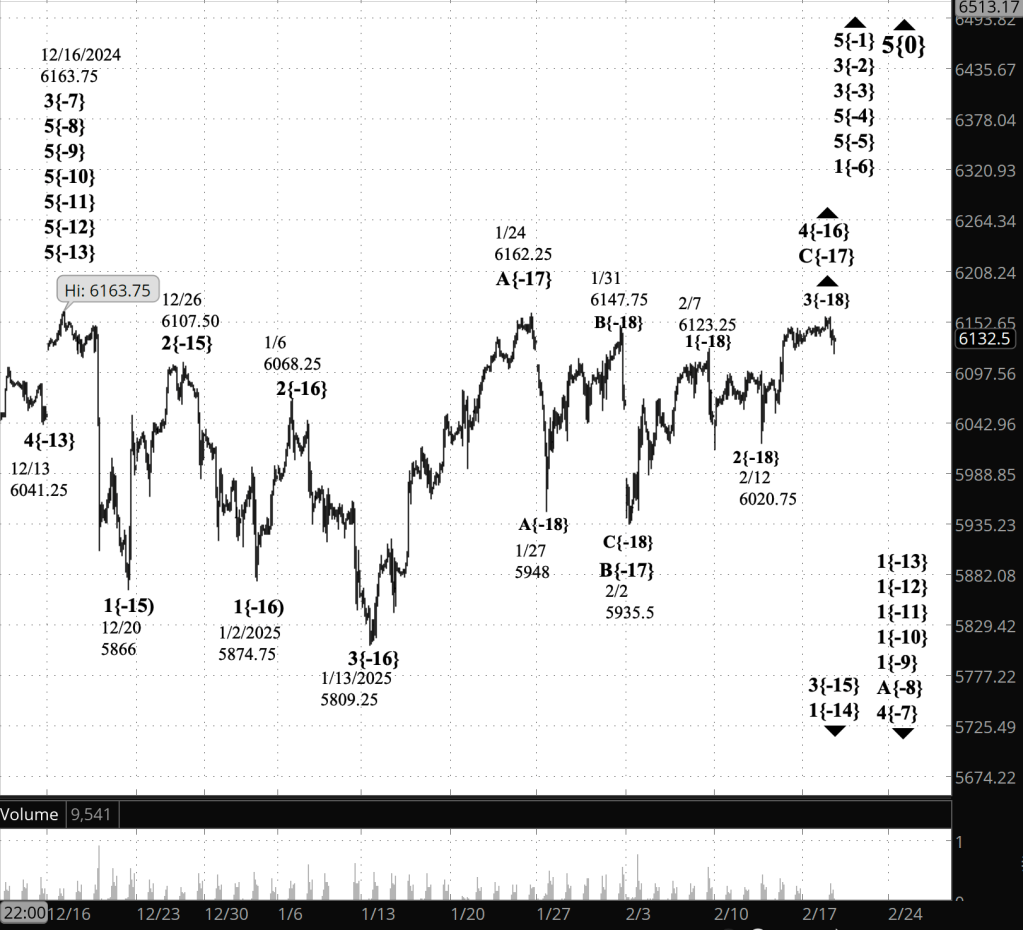
[S&P 500 E-mini futures at 3:30 p.m., 105-minute bars, with volume]
What are the alternatives? The changes have wiped the slate clean of ambiguities for the moment. They will develop, without a doubt, with the passage of time.
What does Elliott wave theory say? Here are the waves that underlie the analyses.
Principal Analysis:
- Rising wave 5{0} is underway. It is a wave of Intermediate degree that began in December 2018.
- It is in its final subwave, wave 5{-1}.
- Within wave 5{-1}, rising waves 5{-2}, 5{-3} and 5{-4} are underway, as is wave 5{-5}.
- Wave 5{-5} is in its initial subwave, wave 1{-6}, which in turn is in its middle subwave, wave 3{-7}.
- Wave 4{-7} is in its initial subwave, which is uptrending wave A{-8}, if wave 4{-7} is a Flat structure, with three subwaves, or wave 1{-8} if it is a Zigzag structure, with five subwaves. (I’ll assume Flat as the list continues, since that’s more common within 4th waves)
- Wave A{-8} is in its initial subwave, wave 1{-9}, as are waves 1{-10}, 1{-11}, 1{-12}, and 1{-13}.
- Wave 1{-14}, an upward correction and is in its first subwave, wave 3{-15}.
- Wave 3{-15} is in its second subwave, rising wave 4{-16}, an upward correction
- Wave 4{-16} is in its final subwave, rising wave C{-17}, which is in its middle subwave, rising wave 3{-18}.
Long-term Waves.
These are the waves currently in progress under my principal analysis. Each line on the list shows the wave number, with the subscript in curly brackets, the traditional degree name, the starting date, the starting price of the S&P 500 E-mini futures, and the direction of the wave. (Updated with today’s reanalysis.)
- S&P 500 Index:
- 5{+3} Supercycle, 7/8/1932, 4.40 (up)
- 5{+2} Cycle, 12/9/1974, 60.96 (up)
- 5{+1} Primary, 3/6/2009, 666.79 (up)
- 5{0} Intermediate, 12/26/2018, 2346.58 (up)
- S&P 500 Futures
- 5{-1} Minor, 10/27/2023, 4127.25 (up)
- 3{-2} Minute, 10/27/23, 4127.75 (up)
- 3{-3} Minuette, 10/27/23, 4127.75 (up)
- 5{-4} Subminuette, 4/18/2024, 4963.50 (up)
- 5{-5} Micro, 8/5/2024, 5120 (up)
- 1{-6} Submicro, 8/5/2024, 5120 (up)
- 4{-7} Minuscule, 12/16/2024, 6163.75 (down)
- A{-8} (unnamed), 12/16/2024, 6163.75 (down)
- 1{-9} (unnamed), 12/16/2024, 6163.75 (down)
- 1{-10} (unnamed), 12/16/2024, 6163.75 (down)
- 1{-11} (unnamed), 12/16/2024, 6163.75 (down)
- 1{-12} (unnamed), 12/16/2024, 6163.75 (down)
- 1{-13} (unnamed), 12/16/2024, 6163.75 (down)
- 1{-14} (unnamed), 1/13/2025, 5809.25 (down)
- 3{-15} (unnamed), 1/13/2025, 5809.25 (down)
- 4{-16} (unnamed), 1/13/2025, 5809.25 (up)
- C{-17} (unnamed), 2/7/2025, 5935.50 (up)
- 3{-18} (unnamed), 2/12/2025, 6020.75 (up)
Reading the chart. Price movements — waves – – in Elliott wave analysis are labeled with numbers within trending waves and letters with corrective waves. The subscripts — numbers in curly brackets — designate the wave’s degree, which, in Elliott wave analysis, means the relative position of a wave within the larger and smaller structures that make up the chart. R.N. Elliott, who in the 1930s developed the form of analysis that bears his name, viewed the chart as a complex structure of smaller waves nested within larger waves, which in turn are nested within still larger waves. In mathematics it’s called a fractal structure, where at every scale the pattern is similar to the others.
Learning and other resources. Elliott wave analysis provides context, not prophecy. As the 20th century semanticist Alfred Korzybski put it in his book Science and Sanity (1933), “The map is not the territory … The only usefulness of a map depends on similarity of structure between the empirical world and the map.” And I would add, in the ever-changing markets, we can judge that similarity of structure only after the fact.
See the menu page Analytical Methods for a rundown on where to go for information on Elliott wave analysis.
By Tim Bovee, Portland, Oregon, February 18, 2025
Disclaimer
Tim Bovee, Private Trader tracks the analysis and trades of a private trader for his own accounts. Nothing in this blog constitutes a recommendation to buy or sell stocks, options or any other financial instrument. The only purpose of this blog is to provide education and entertainment.
No trader is ever 100 percent successful in his or her trades. Trading in the stock and option markets is risky and uncertain. Each trader must make trading decisions for his or her own account, and take responsibility for the consequences.
All content on Tim Bovee, Private Trader by Timothy K. Bovee is licensed under a Creative Commons Attribution-ShareAlike 4.0 International License.
Based on a work at www.timbovee.com

You must be logged in to post a comment.