5:30 p.m. New York time
Sneak Preview. I’ve been working for hours to put together the new analysis. The S&P 500 futures breaking an Elliott Wave Theory rule, which scrapped the prior analysis, turns out to have implications stretching back several years.
Details when I post at 6:35 a.m. New York time tomorrow. Meanwhile, a sneak preview of the new futures chart.
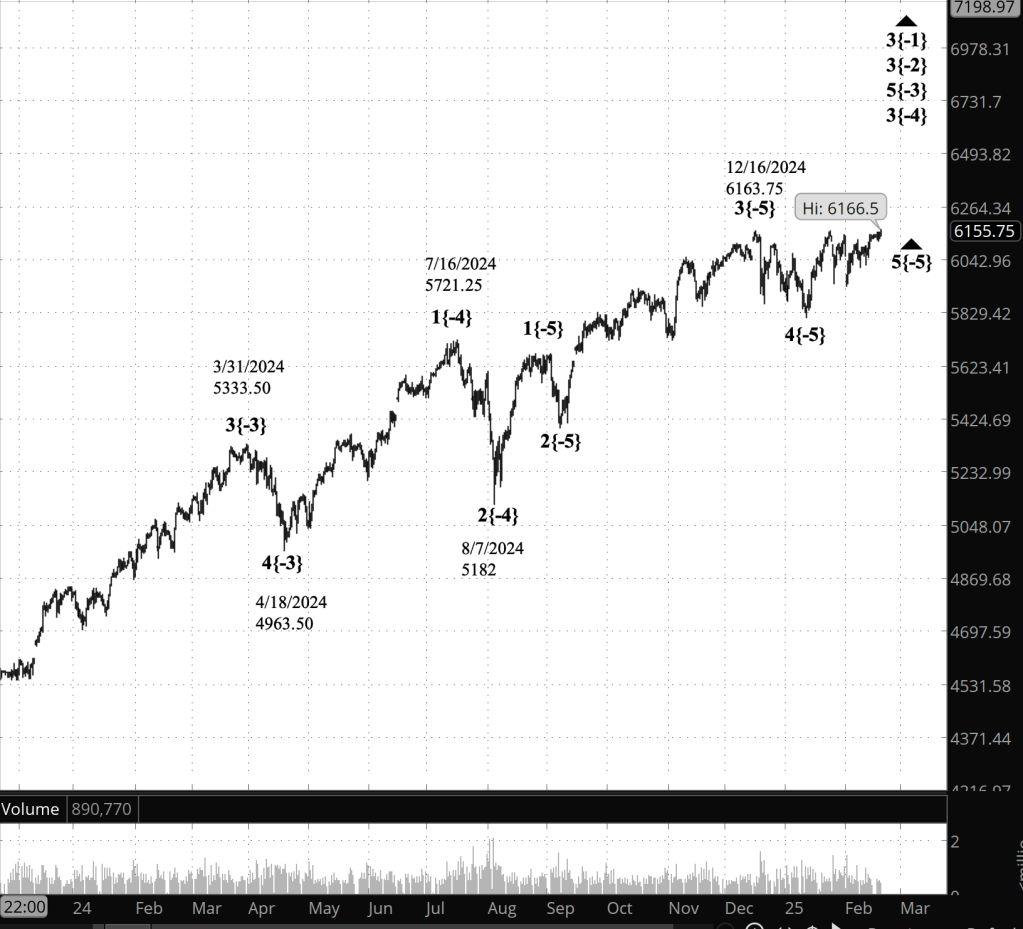
[S&P 500 E-mini futures at 5:30 p.m., 12-hour bars, with volume]
3:30 p.m. New York time
Half an hour before the opening bell. Perhaps a better section title would be…
The end of the chart as we know it. The S&P 500 futures have reached a high so far during the session of 6166.50.
Here’s a preliminary assessment:
- Under the formerly valid chart, breaking past the 5th wave endpoint is a violation of the rules of Elliott Wave Theory.
- Three possibilities: The wave count was incorrect, the supposed top was not the final high, or a more complex corrective structure is unfolding.
I’ve updated the chart, with a big label saying it is no longer the principal analysis. Look for a new analysis in tomorrow morning’s post.
This morning’s analysis is no longer valid. The wave lists are no longer valid. And the “What are the alternatives” section now has a world-class alternative that will be implemented.
9:35 a.m. New York time
What’s happening now? The S&P 500 E-mini futures fell overnight, from the 6150s to the 6130s.
What does it mean? The Elliott Wave Theory analysis sees the fall as a subwave correction within the rising 3rd wave that began on February 12.
Wave 3, when complete, will be followed by a 4th-wave downward correction and then a rising 5th wave, which will bring to an end the final subwave, wave C, of a larger 4th-wave upward correction that began on January 13.
A downtrending 5th wave will follow, potentially carrying the price below 5800, and possibly significantly lower.
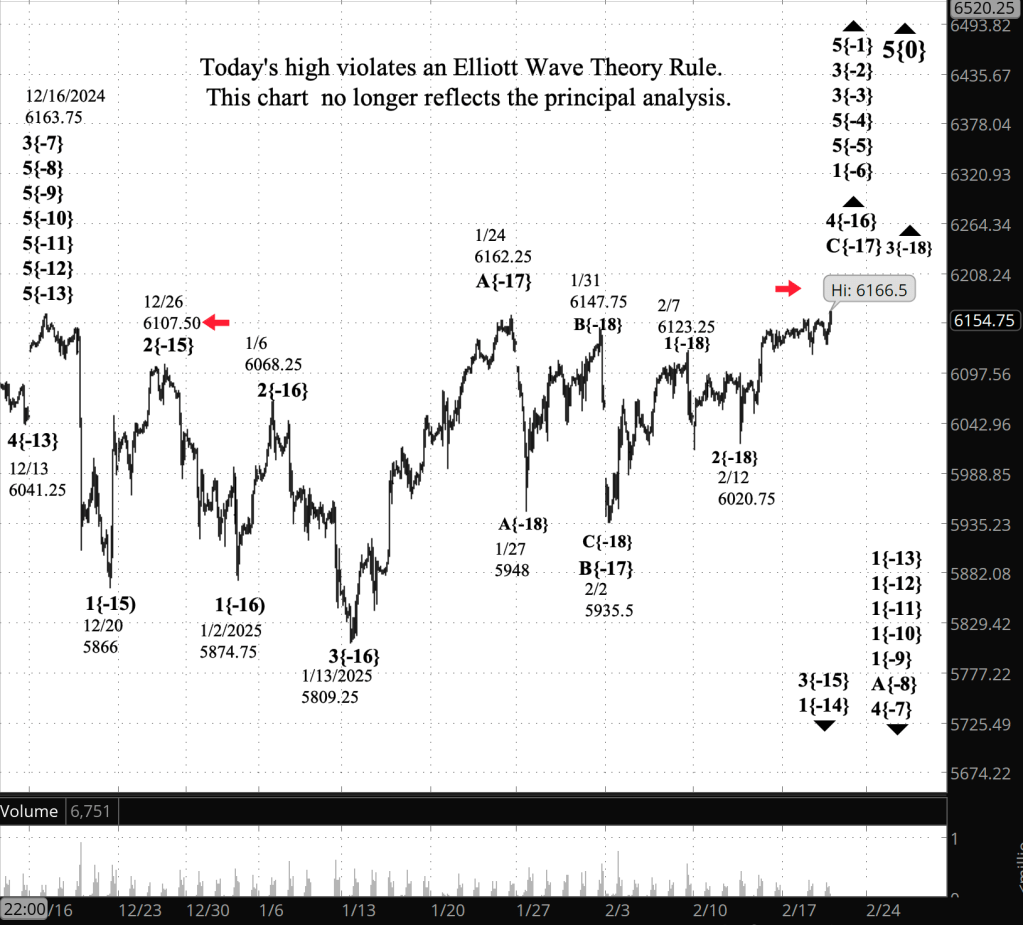
[S&P 500 E-mini futures at 3:30 p.m., 105-minute bars, with volume]
What are the alternatives? None visible at present. As always, they will arise.
What does Elliott wave theory say? Here are the waves that underlie the analyses.
Principal Analysis:
- Rising wave 5{0} is underway. It is a wave of Intermediate degree that began in December 2018.
- It is in its final subwave, wave 5{-1}.
- Within wave 5{-1}, rising waves 5{-2}, 5{-3} and 5{-4} are underway, as is wave 5{-5}.
- Wave 5{-5} is in its initial subwave, wave 1{-6}, which in turn is in its middle subwave, wave 3{-7}.
- Wave 4{-7} is in its initial subwave, which is uptrending wave A{-8}, if wave 4{-7} is a Flat structure, with three subwaves, or wave 1{-8} if it is a Zigzag structure, with five subwaves. (I’ll assume Flat as the list continues, since that’s more common within 4th waves)
- Wave A{-8} is in its initial subwave, wave 1{-9}, as are waves 1{-10}, 1{-11}, 1{-12}, and 1{-13}.
- Wave 1{-14}, an upward correction and is in its first subwave, wave 3{-15}.
- Wave 3{-15} is in its second subwave, rising wave 4{-16}, an upward correction
- Wave 4{-16} is in its final subwave, rising wave C{-17}, which is in its middle subwave, rising wave 3{-18}.
Long-term Waves.
These are the waves currently in progress under my principal analysis. Each line on the list shows the wave number, with the subscript in curly brackets, the traditional degree name, the starting date, the starting price of the S&P 500 E-mini futures, and the direction of the wave. (Updated with today’s reanalysis.)
- S&P 500 Index:
- 5{+3} Supercycle, 7/8/1932, 4.40 (up)
- 5{+2} Cycle, 12/9/1974, 60.96 (up)
- 5{+1} Primary, 3/6/2009, 666.79 (up)
- 5{0} Intermediate, 12/26/2018, 2346.58 (up)
- S&P 500 Futures
- 5{-1} Minor, 10/27/2023, 4127.25 (up)
- 3{-2} Minute, 10/27/23, 4127.75 (up)
- 3{-3} Minuette, 10/27/23, 4127.75 (up)
- 5{-4} Subminuette, 4/18/2024, 4963.50 (up)
- 5{-5} Micro, 8/5/2024, 5120 (up)
- 1{-6} Submicro, 8/5/2024, 5120 (up)
- 4{-7} Minuscule, 12/16/2024, 6163.75 (down)
- A{-8} (unnamed), 12/16/2024, 6163.75 (down)
- 1{-9} (unnamed), 12/16/2024, 6163.75 (down)
- 1{-10} (unnamed), 12/16/2024, 6163.75 (down)
- 1{-11} (unnamed), 12/16/2024, 6163.75 (down)
- 1{-12} (unnamed), 12/16/2024, 6163.75 (down)
- 1{-13} (unnamed), 12/16/2024, 6163.75 (down)
- 1{-14} (unnamed), 1/13/2025, 5809.25 (down)
- 3{-15} (unnamed), 1/13/2025, 5809.25 (down)
- 4{-16} (unnamed), 1/13/2025, 5809.25 (up)
- C{-17} (unnamed), 2/7/2025, 5935.50 (up)
- 3{-18} (unnamed), 2/12/2025, 6020.75 (up)
Reading the chart. Price movements — waves – – in Elliott wave analysis are labeled with numbers within trending waves and letters with corrective waves. The subscripts — numbers in curly brackets — designate the wave’s degree, which, in Elliott wave analysis, means the relative position of a wave within the larger and smaller structures that make up the chart. R.N. Elliott, who in the 1930s developed the form of analysis that bears his name, viewed the chart as a complex structure of smaller waves nested within larger waves, which in turn are nested within still larger waves. In mathematics it’s called a fractal structure, where at every scale the pattern is similar to the others.
Learning and other resources. Elliott wave analysis provides context, not prophecy. As the 20th century semanticist Alfred Korzybski put it in his book Science and Sanity (1933), “The map is not the territory … The only usefulness of a map depends on similarity of structure between the empirical world and the map.” And I would add, in the ever-changing markets, we can judge that similarity of structure only after the fact.
See the menu page Analytical Methods for a rundown on where to go for information on Elliott wave analysis.
By Tim Bovee, Portland, Oregon, February 19, 2025
Disclaimer
Tim Bovee, Private Trader tracks the analysis and trades of a private trader for his own accounts. Nothing in this blog constitutes a recommendation to buy or sell stocks, options or any other financial instrument. The only purpose of this blog is to provide education and entertainment.
No trader is ever 100 percent successful in his or her trades. Trading in the stock and option markets is risky and uncertain. Each trader must make trading decisions for his or her own account, and take responsibility for the consequences.
All content on Tim Bovee, Private Trader by Timothy K. Bovee is licensed under a Creative Commons Attribution-ShareAlike 4.0 International License.
Based on a work at www.timbovee.com

You must be logged in to post a comment.