3:30 p.m. New York time
Half an hour before the closing bell. The S&P 500 futures reached a low of 6102.75 half an hour into the session, and then rose back into the 6130s.
I’ve added a more detailed Elliott Wave Theory mark-up on the chart focusing on price movements from December 16, 2024. This morning I included three charts, from a 10-year monstrosity down to one covering the past few months. It’s that third chart, the one furthest down, that has been updated.
Bottom line: A low-degree 4th-wave downward correction is underway, within an uptrending 1st wave that began on February 12. That 1st wave is a subwave of a rising 3rd wave that began on February 2.
9:35 a.m. New York time
What’s happening now? The S&P 500 E-mini futures fell slightly overnight, from the 6150s to the 6140s.
What does it mean? A rule of Elliott Wave Theory was violated during yesterday’s session: A 4th-wave upward correction rose higher than the December 16, 2024 peak, which by the analysis up to yesterday had marked the end of a large number of 5th waves.
The beauty of Elliott Wave Theory is that when the count no longer matches the reality of the chart — when the wave labels are wrong — the analyst knows it immediately. And since the chart is always right, the analysis must be changed.
In looking at the new reality, the new terrain, it seemed to me that there were a couple of options. The bullish option would see the December 16, 2024 high as being a step within an ongoing rise. To fix that would mean going back to 2020 and modifying the wave count. An alternative bearish option would have been to retain the December peak as the end of a major rise, and to postulate a complex corrective form that would explain away the rule violation.
The bullish option seemed more straightforward, and as I recounted waves from a few years ago, it became clear that the bullish revision would be in accord with the Rules of Elliott. And that bullish revision is what we see today.
Could it be wrong? Maybe. No Elliott Wave Theory analysis is 100% certain. If it turns out to not match the reality of the chart, we’ll all know it, and for my analysis, I’ll fix it
The following series of charts begins with a big view of the S&P 500 index from the 2020s onward, then a closer view of the S&P 500 futures, and then a still closer view, also of the futures.
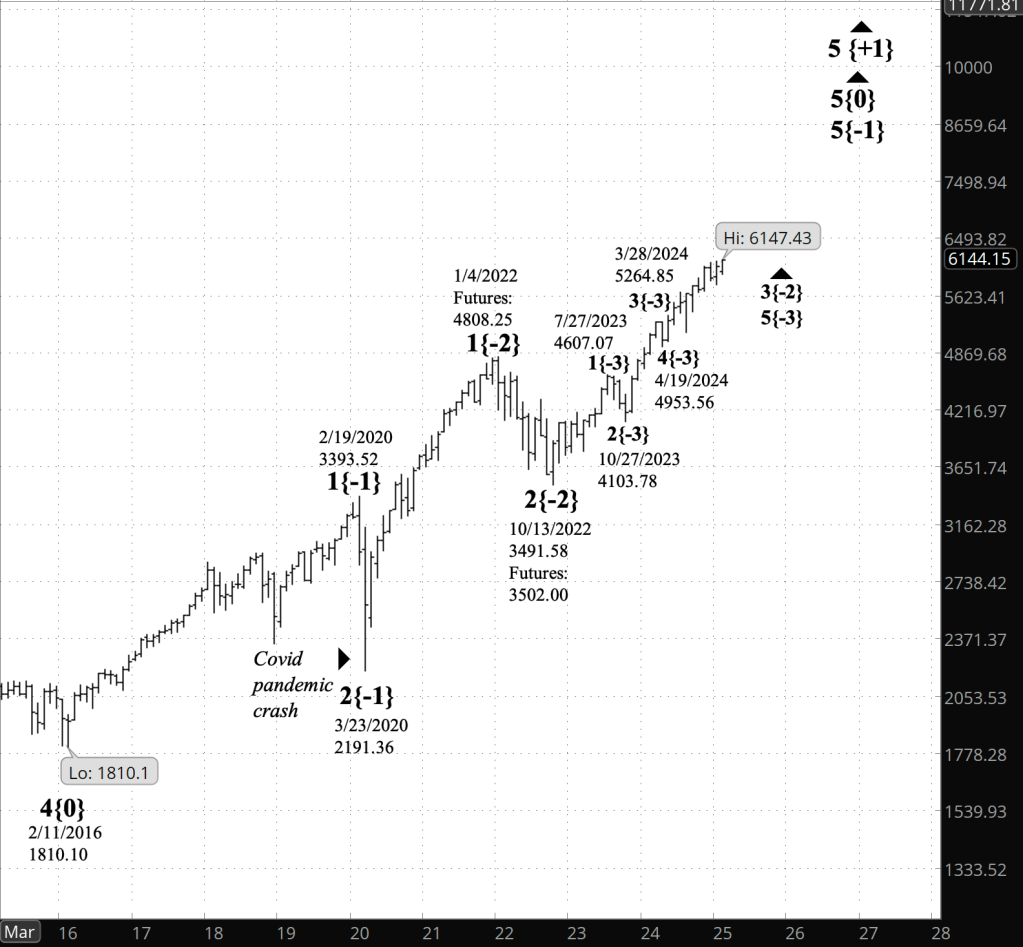
[S&P 500 index 2/19/2025 close, monthly bars]

[S&P 500 E-mini futures, 2/19/2024 close, 12-hour bars, with volume]
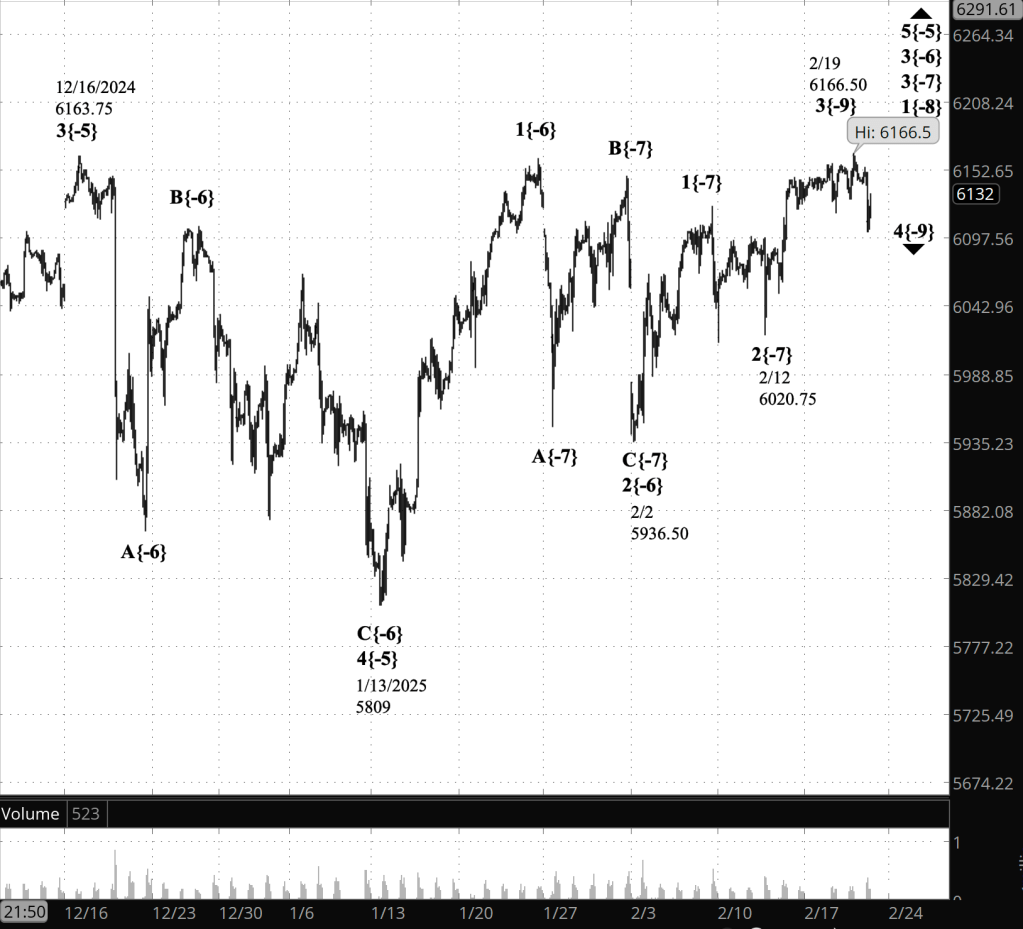
[S&P 500 E-mini futures at 3:30 p.m., 110-minute bars, with volume]
What are the alternatives? This reanalysis is still a work in progress, and will be stretching into the weekend. I wouldn’t be surprised if I discovered changes that need to be made.
What does Elliott wave theory say? The waves that underlie the analyses will be available later There’s much revision to done.:
Long-term Waves.
Not yet available. Revision underway.
Reading the chart. Price movements — waves – – in Elliott wave analysis are labeled with numbers within trending waves and letters with corrective waves. The subscripts — numbers in curly brackets — designate the wave’s degree, which, in Elliott wave analysis, means the relative position of a wave within the larger and smaller structures that make up the chart. R.N. Elliott, who in the 1930s developed the form of analysis that bears his name, viewed the chart as a complex structure of smaller waves nested within larger waves, which in turn are nested within still larger waves. In mathematics it’s called a fractal structure, where at every scale the pattern is similar to the others.
Learning and other resources. Elliott wave analysis provides context, not prophecy. As the 20th century semanticist Alfred Korzybski put it in his book Science and Sanity (1933), “The map is not the territory … The only usefulness of a map depends on similarity of structure between the empirical world and the map.” And I would add, in the ever-changing markets, we can judge that similarity of structure only after the fact.
See the menu page Analytical Methods for a rundown on where to go for information on Elliott wave analysis.
By Tim Bovee, Portland, Oregon, February 20, 2025
Disclaimer
Tim Bovee, Private Trader tracks the analysis and trades of a private trader for his own accounts. Nothing in this blog constitutes a recommendation to buy or sell stocks, options or any other financial instrument. The only purpose of this blog is to provide education and entertainment.
No trader is ever 100 percent successful in his or her trades. Trading in the stock and option markets is risky and uncertain. Each trader must make trading decisions for his or her own account, and take responsibility for the consequences.
All content on Tim Bovee, Private Trader by Timothy K. Bovee is licensed under a Creative Commons Attribution-ShareAlike 4.0 International License.
Based on a work at www.timbovee.com

You must be logged in to post a comment.