3:30 p.m. New York time
Half an hour before the closing bell. The S&P 500 futures began to fall at the opening bell and has continued to fall during the session, so far reaching 6024.50.
Elliott Wave Theory: The decline is a 4th-wave downward correction began on February 19 from 6166.50. Most 4th waves that I’ve analyzed have tended to be more moderate, retracing on a third or so of the preceding 3rd wave.
This 4th wave has moved beyond the starting point of the 3rd wave and is coming close to dropping below the starting point of the preceding 1st wave. That breaks a rule of Elliott Wave Theory and requires a reanalysis, possibly of everything since the February 2 low.
But not yet. The 4th wave hasn’t broken the rule yet and may reverse to the upside before it does so.
9:35 a.m. New York time
What’s happening now? The S&P 500 E-mini futures fell to 6127.25 overnight and then rose into the 6140s as the opening bell approached. As the bell sounded, the price drop sharply into the 6120s
What does it mean? Now underway in terms of Elliott Wave Theory: The 4th-wave downward correction, a subwave of a 1st wave that began on February 12, which in turn is a subwave of a still larger 3rd wave that also began on that date.
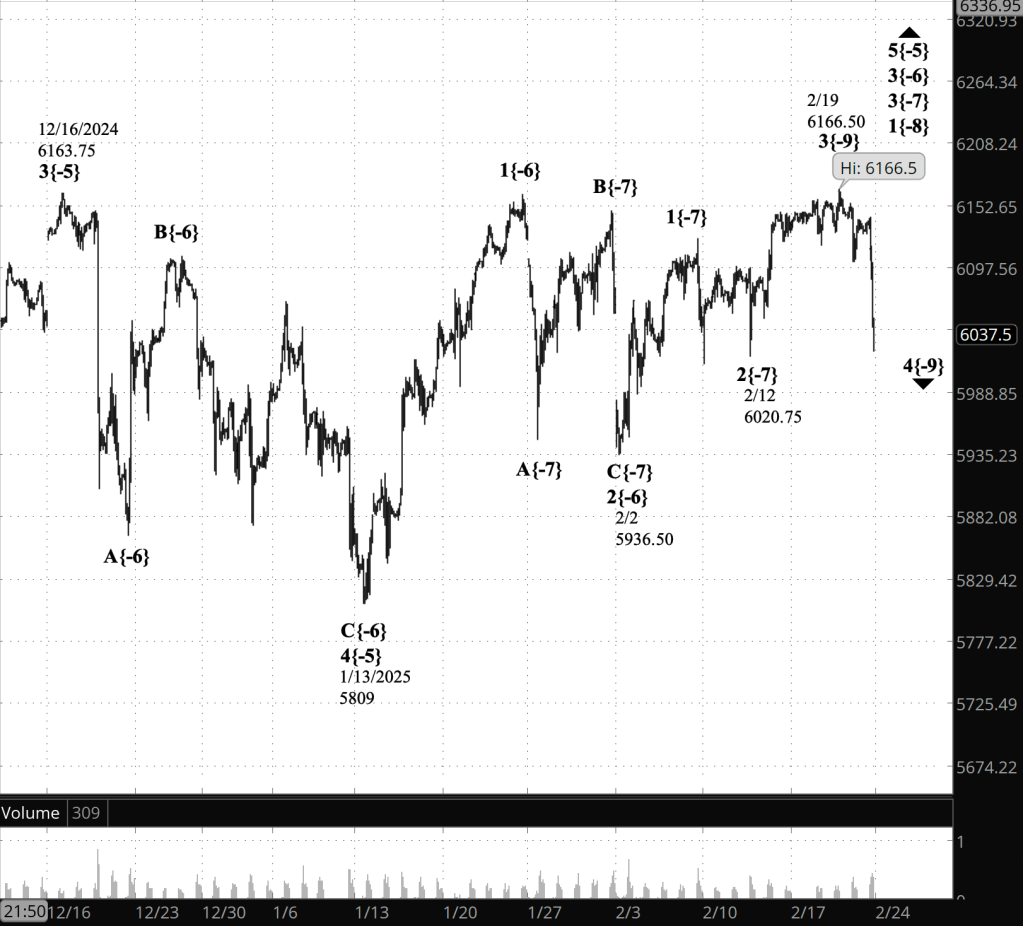
[S&P 500 E-mini futures at 3:30 p.m., 110-minute bars, with volume]
What are the alternatives? The 4th-wave downward correction may have ended at the February 20 low, 6102.75, or that might have only been the end of the first subwave, wave A, within the correction. I’ve chosen the wave A scenario as my principal analysis, and the completed 4th wave as my alternative analysis.
What does Elliott wave theory say? Here are the waves that underly the analyses as they appear on the chart.
Principal Analysis:
- Wave 4{-9}, a downward correction now underway, is a subwave of wave 1{-8}, which is turn is a subwave of wave 3{-7}.
Alternative Analysis:
- Wave 4{-9} ended on February 20 and rising wave 5{-9} has begun.
Long-term Waves.
These are the waves currently in progress under my principal analysis. Each line on the list shows the wave number, with the subscript in curly brackets, the traditional degree name, the starting date, the starting price of the S&P 500 E-mini futures, and the direction of the wave.
- S&P 500 Index:
- 5{+3} Supercycle, 7/8/1932, 4.40 (up)
- 5{+2} Cycle, 12/9/1974, 60.96 (up)
- 5{+1} Primary, 3/6/2009, 666.79 (up)
- 5{0} Intermediate, 2/11/2016, 1810.10 (up)
- 3{-1} Minor, 3/23/2020, 2191.36 (up)
- 3{-2} Minute, 10/13/2022, 3491.58 (up)
- S&P 500 Futures
- 5{-3} Minuette, 4/18/2024, 4963.50 (up)
- 3{-4} Subminuette, 8/7/2024, 5182 (up)
- 5{-5} Micro, 1/13/2025, 5809 (up)
- 3{-6} Submicro, 2/2/2025, 5936.50 (up)
- 3{-7} Minuscule, 2/12/2025, 6120.75 (up)
- 1{-8} (unnamed), 2/12/2025, 6120.75 (up)
- 4{-9} (unnamed), 2/19/2025, 6166.50 (down)
Correction. The 10-year chart published on February 20 listed the {-1} degree wave now underway as wave 5{-1}. It is wave 3{-1}.
Reading the chart. Price movements — waves – – in Elliott wave analysis are labeled with numbers within trending waves and letters with corrective waves. The subscripts — numbers in curly brackets — designate the wave’s degree, which, in Elliott wave analysis, means the relative position of a wave within the larger and smaller structures that make up the chart. R.N. Elliott, who in the 1930s developed the form of analysis that bears his name, viewed the chart as a complex structure of smaller waves nested within larger waves, which in turn are nested within still larger waves. In mathematics it’s called a fractal structure, where at every scale the pattern is similar to the others.
Learning and other resources. Elliott wave analysis provides context, not prophecy. As the 20th century semanticist Alfred Korzybski put it in his book Science and Sanity (1933), “The map is not the territory … The only usefulness of a map depends on similarity of structure between the empirical world and the map.” And I would add, in the ever-changing markets, we can judge that similarity of structure only after the fact.
See the menu page Analytical Methods for a rundown on where to go for information on Elliott wave analysis.
By Tim Bovee, Portland, Oregon, February 21, 2025
Disclaimer
Tim Bovee, Private Trader tracks the analysis and trades of a private trader for his own accounts. Nothing in this blog constitutes a recommendation to buy or sell stocks, options or any other financial instrument. The only purpose of this blog is to provide education and entertainment.
No trader is ever 100 percent successful in his or her trades. Trading in the stock and option markets is risky and uncertain. Each trader must make trading decisions for his or her own account, and take responsibility for the consequences.
All content on Tim Bovee, Private Trader by Timothy K. Bovee is licensed under a Creative Commons Attribution-ShareAlike 4.0 International License.
Based on a work at www.timbovee.com

You must be logged in to post a comment.