3:30 p.m. New York time
Half an hour before the closing bell. The S&P 500 futures continued to fall during the session.
Elliott Wave Theory: The price remains within the range of the 4th subwave within the previous rising 3rd wave. This morning’s Alternation Analysis was correct and has been promoted to the new Principal Analysis on the chart. The final subwave, wave C, of the present 4th-wave corrective pattern continues.We are at one of those bottom-fishing moments where any lower low can be the end of the present wave. Or not.
9:35 a.m. New York time
What’s happening now? The S&P 500 E-mini futures rose slightly overnight, from the 5960s to the 6010s.
What does it mean? In Elliott Wave Theory, the rise from February 25 is a small countertrend correction that began from 5924.
Beyond that, the chart lacks clarity, a not unusual occurrence in Elliott Wave Theory. Are we in wave 4 or has wave 5 begun? Let’s try to puzzle it out.
A 4th wave tends to end within the range of the 4th subwave within the preceding 3rd-wave. In this case, that 4th wave occurred from November 11 to November 19, 2024, carrying the pricer from 6043.50 to 5855, a span of 188.5. I’ve marked the price on the chart in red.
The low point of the present 4th wave has been 5924 so far, placing it within the range of the 4th subwave of prior 3rd wave. Since this 4th wave is within the 4th of 3rd, and since a straightward labeling of the subwave leading to the February 25 low at wave 5, then wave C has ended.
Going forward, two possibilities: Either the 4th wave is taking a simple corrective pattern and therefore ended on February 25, or the 4th is taking a compound pattern, with two or three corrective patterns.
If it’s simple, the rise since February 25 is an early stage of wave 5. If it’s compound, then the rise is connector wave, an X wave, separating the first corrective pattern from the future second corrective pattern.
I’m choosing the simple corrective pattern for the Principal Analysis, reserving the compound pattern for the Alternative Analysis.
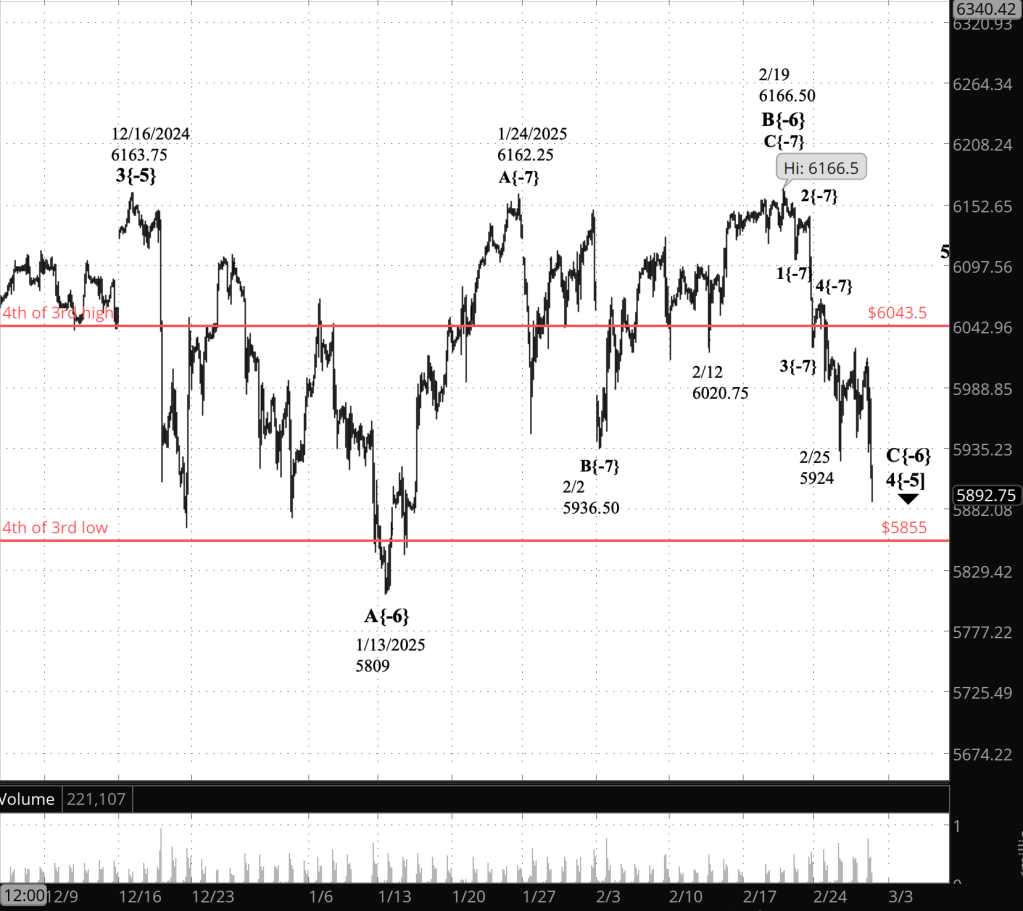
[S&P 500 E-mini futures at 3:30 p.m., 110-minute bars, with volume]
What is the alternative? Potentially, a compound correction lies ahead. See Alternative Analyss #2, below.
What does Elliott Wave Theory say? Here are the waves that underlie the morning’s analyses as they appeared on the chart.
Principal Analysis:
Demoted to Alternative Analysis during the session.
- Wave C{-6} within wave 4{-5} has ended.
- Rising wave 5{-5} has begun.
Alternative Analysis #1
Promoted to Principal Analysis during the session
- Wave C{-6} within wave 4{-5} continues
Alternative Analysis #2
- Wave 4{-5} is taking a compund form and the connector subwave, wave X{-6}, has begun.
Long-term Waves.
These are the waves currently in progress under my principal analysis. Each line on the list shows the wave number, with the subscript in curly brackets, the traditional degree name, the starting date, the starting price of the S&P 500 E-mini futures, and the direction of the wave. This list has been revised to reflect the revised Principal Analysis.
- S&P 500 Index:
- 5{+3} Supercycle, 7/8/1932, 4.40 (up)
- 5{+2} Cycle, 12/9/1974, 60.96 (up)
- 5{+1} Primary, 3/6/2009, 666.79 (up)
- 5{0} Intermediate, 2/11/2016, 1810.10 (up)
- 3{-1} Minor, 3/23/2020, 2191.36 (up)
- 3{-2} Minute, 10/13/2022, 3491.58 (up)
- S&P 500 Futures
- 5{-3} Minuette, 4/18/2024, 4963.50 (up)
- 4{-5} Micro, 12/16/2025, 6163.75 (down)
- C{-6} Submicro, 2/19/2025, 6166.50 (down)
Reading the chart. Price movements — waves – – in Elliott Wave Theory analysis are labeled with numbers within trending waves and letters with corrective waves. The subscripts — numbers in curly brackets — designate the wave’s degree, which, in Elliott Wave analysis, means the relative position of a wave within the larger and smaller structures that make up the chart. R.N. Elliott, who in the 1930s developed the form of analysis that bears his name, viewed the chart as a complex structure of smaller waves nested within larger waves, which in turn are nested within still larger waves. In mathematics it’s called a fractal structure, where at every scale the pattern is similar to the others.
Learning and other resources. Elliott Wave analysis provides context, not prophecy. As the 20th century semanticist Alfred Korzybski put it in his book Science and Sanity (1933), “The map is not the territory … The only usefulness of a map depends on similarity of structure between the empirical world and the map.” And I would add, in the ever-changing markets, we can judge that similarity of structure only after the fact.
See the menu page Analytical Methods for a rundown on where to go for information on Elliott Wave analysis.
By Tim Bovee, Portland, Oregon, February 27, 2025
Disclaimer
Tim Bovee, Private Trader tracks the analysis and trades of a private trader for his own accounts. Nothing in this blog constitutes a recommendation to buy or sell stocks, options or any other financial instrument. The only purpose of this blog is to provide education and entertainment.
No trader is ever 100 percent successful in his or her trades. Trading in the stock and option markets is risky and uncertain. Each trader must make trading decisions for his or her own account, and take responsibility for the consequences.
All content on Tim Bovee, Private Trader by Timothy K. Bovee is licensed under a Creative Commons Attribution-ShareAlike 4.0 International License.
Based on a work at www.timbovee.com

[…] Trader’s Notebook […]
LikeLike