3:30 p.m. New York time
Half an hour before the closing bell. The S&P 500 futures reached a slightly lower low during the session, 5848, and then withdrew to above 5900.
This morning’s ambiguity continues into the afternoon. Elliott Wave Theory: It’s a 5th wave that’s underway or a 4th wave, and its not certain which view is correct.
The session low, 5848, took the price below the lower bounday that is the ending target for the 4th wave: The range of the 4th subwave within the rising 3rd wave the preceded the present 4th-wave correction.
Based on more than 90 yers of experience with Elliott Wave analysis, the expectation would be that wave 4 has ended and wave 5 has begun. But that’s based on a tendency, not a rule. So I’m applying some skepticism to the matter.
9:35 a.m. New York time
What’s happening now? The S&P 500 E-mini futures fell early in the overnight session, to 5858.50, and then rose slightly above 5900.
What does it mean? The Elliott Wave Theory analysis is precisely where it was in yesterday’s analysis: The decline appears to be the end of the final subwave, wave C, within the 4th-wave downward correction that began on December 16, 2024. That turned out to be an unfortunate conclusion, as the price flipped back into a decline, forcing a retraction of the morning analysis.
This time around, there is an even greater reason to conclude that wave C has ended.
A 4th wave correction tends to end within the 4th subwave of the preceding 3rd wave. The low point of that subwave was 5855, reached on November 19, 2024. The low point overnighj was 5858.50.
As the old acknowledgement of remorse goes, “Once burned, twice shy.” Having been burned yesterday, I’m relutant to call wave 4 complete until I’ve seen more of a rise. In the meantime, I’m sticking within an irritating pair of conclsions: Either falling wave 4 in in its last legs, or rising wave 5 has begun.
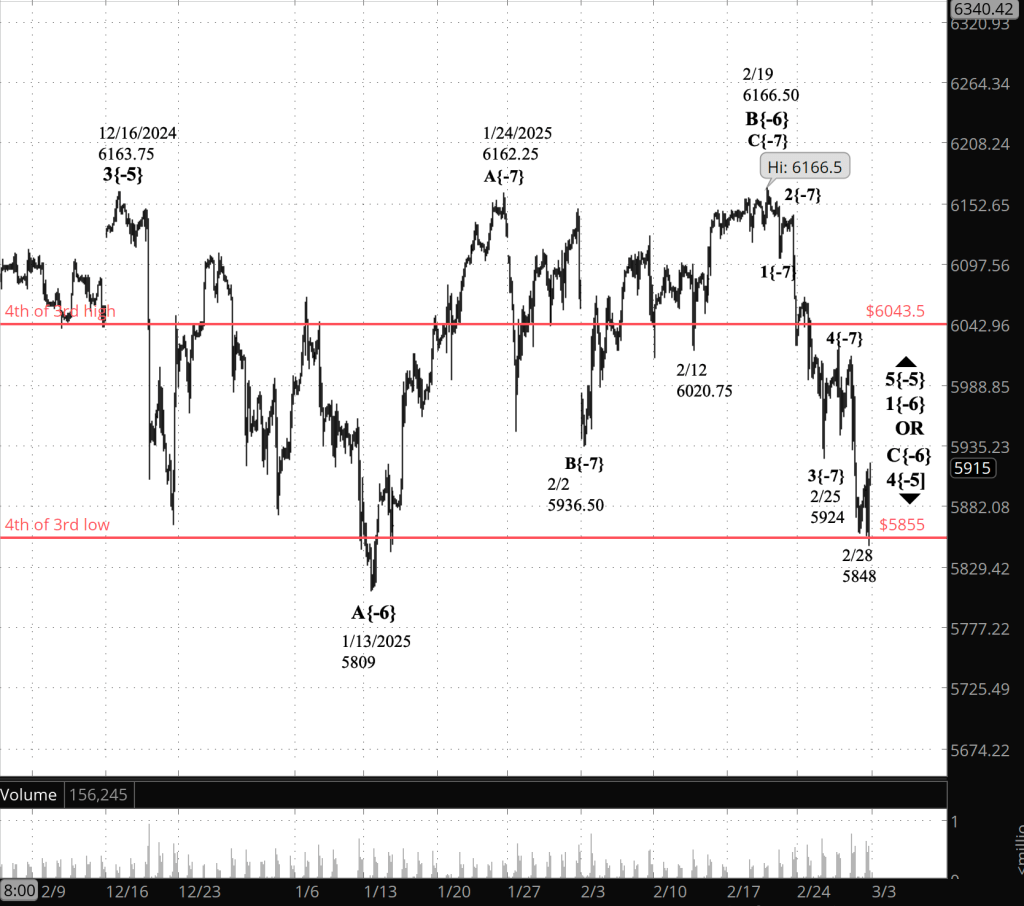
[S&P 500 E-mini futures at 3:30 p.m., 2-hour bars, with volume]
What is the alternative? So there is no Principal Analysis at this point; only two alternatives.
What does Elliott Wave Theory say? Here are the waves that underlie the morning’s analyses as they appeared on the chart.
Alternative Analysis #1, Wave 4 Scenario:
- Wave C{-6} within wave 4{-5} continues.
Alternative Analysis #2, Wave 5 Scenario
- Wave C{-6} within wave 4{-5} has ended.
- Rising wave 5{-5} has begun.
And there’s another.
Alternative Analysis #3, Wave X Scenario
- Wave 4{-5} is taking a comppund form and the connector subwave, wave X{-6}, has begun.
- A compound form means that the correction has two or three corrective patterns, each connected with the next by an X wave
Long-term Waves.
These are the waves currently in progress under my principal analysis. Each line on the list shows the wave number, with the subscript in curly brackets, the traditional degree name, the starting date, the starting price of the S&P 500 E-mini futures, and the direction of the wave.
- S&P 500 Index:
- 5{+3} Supercycle, 7/8/1932, 4.40 (up)
- 5{+2} Cycle, 12/9/1974, 60.96 (up)
- 5{+1} Primary, 3/6/2009, 666.79 (up)
- 5{0} Intermediate, 2/11/2016, 1810.10 (up)
- 3{-1} Minor, 3/23/2020, 2191.36 (up)
- 3{-2} Minute, 10/13/2022, 3491.58 (up)
- S&P 500 Futures
- 5{-3} Minuette, 4/18/2024, 4963.50 (up)
- 3{-4} Subminuette, 8/7/2024, 5182 (up)
- 4{-5} Micro, 12/16/2025, 6163.75 (down)
- C{-6} Submicro, 2/19/2025, 6166.50 (down)
Or alternatively,
- 5{-5} Micro, 2/27/2025, 5855.50 (up)
- 1{-6} Submicro, 2/27/2025, 5855.50 (up)
And yet another
- Wave X{-6}, 2//27/2025, 5855.50 (up)
Reading the chart. Price movements — waves – – in Elliott Wave Theory analysis are labeled with numbers within trending waves and letters with corrective waves. The subscripts — numbers in curly brackets — designate the wave’s degree, which, in Elliott Wave analysis, means the relative position of a wave within the larger and smaller structures that make up the chart. R.N. Elliott, who in the 1930s developed the form of analysis that bears his name, viewed the chart as a complex structure of smaller waves nested within larger waves, which in turn are nested within still larger waves. In mathematics it’s called a fractal structure, where at every scale the pattern is similar to the others.
Learning and other resources. Elliott Wave analysis provides context, not prophecy. As the 20th century semanticist Alfred Korzybski put it in his book Science and Sanity (1933), “The map is not the territory … The only usefulness of a map depends on similarity of structure between the empirical world and the map.” And I would add, in the ever-changing markets, we can judge that similarity of structure only after the fact.
See the menu page Analytical Methods for a rundown on where to go for information on Elliott Wave analysis.
By Tim Bovee, Portland, Oregon, February 28, 2025
Disclaimer
Tim Bovee, Private Trader tracks the analysis and trades of a private trader for his own accounts. Nothing in this blog constitutes a recommendation to buy or sell stocks, options or any other financial instrument. The only purpose of this blog is to provide education and entertainment.
No trader is ever 100 percent successful in his or her trades. Trading in the stock and option markets is risky and uncertain. Each trader must make trading decisions for his or her own account, and take responsibility for the consequences.
All content on Tim Bovee, Private Trader by Timothy K. Bovee is licensed under a Creative Commons Attribution-ShareAlike 4.0 International License.
Based on a work at www.timbovee.com

You must be logged in to post a comment.