3:30 p.m. New York time
Half an hour before the closing bell. The S&P 500 futures, after rising early in the session, began to fall, reaching into the 5720s.
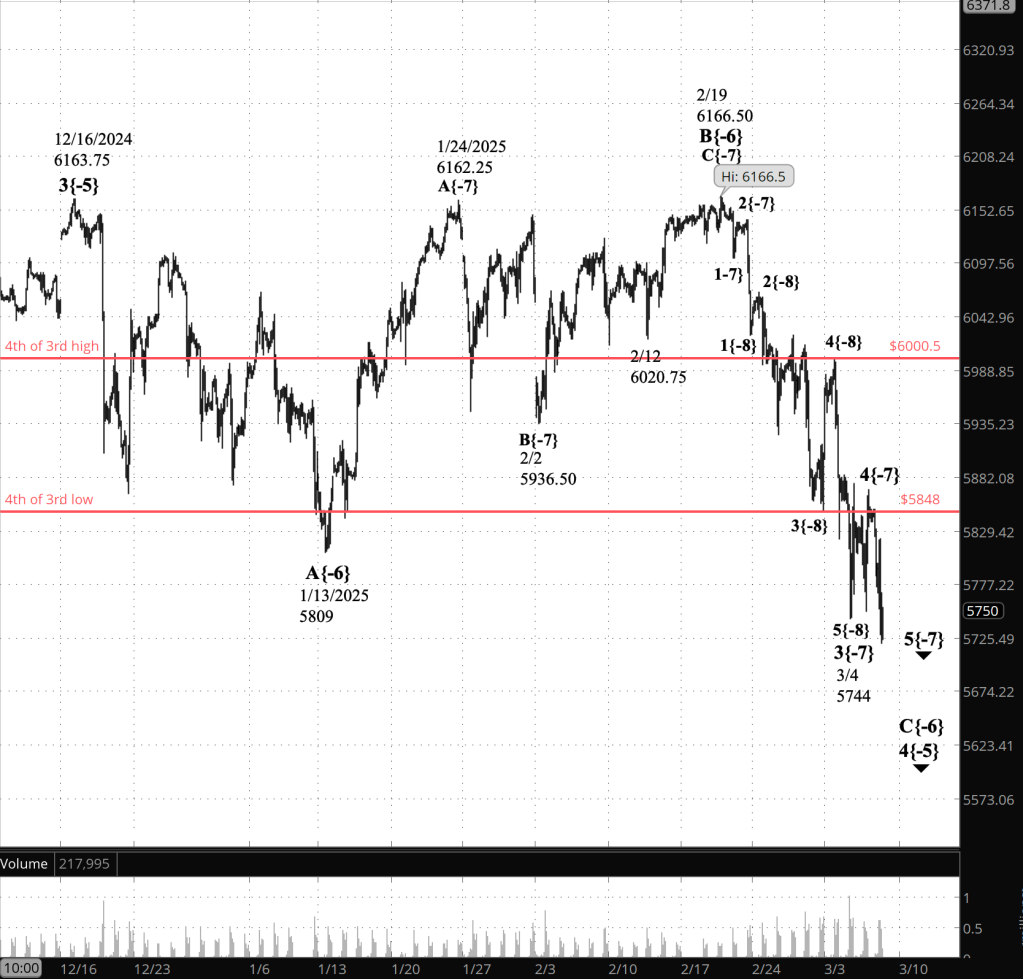
That lower level is below the start of the 4th wave (wave 4{-7} on the chart), signalling that the 5th and final wave of the C wave within a larger downward correction, wave 4{-5), has begun.
9:35 a.m. New York time
What’s happening now? The S&P 500 E-mini futures fell overnight, from the 5850s to the 5760s.
What does it mean? The early subwaves of the 4th-wave upward correction that began on March 4 continues.
In Elliott Wave Theory, a 4th wave often reach completion within the 4th subwave of preceding 3rd wave. The 3rd wave in question is labeled wave 3{-7} on the chart, and I’ve indicated the upper and lower boundaries of wave 4{-8} — the 4th of 3rd — in red.
So the present 4th-wave upward correction is likely to end somewhere in the neighborhood of 5848 and 6000.50, with allowance made for the occasional breakout.
The upward correction is a subwave of the final subwave of of the larger downward correction, wave 4{-5} on the chart, which began on December 16, 2024, from 6163.75.
That larger 4th wave, when complete, will be followed by a rising 5th wave that will most likely move above the starting point of the 5th wave, perhaps significantly so.
[S&P 500 E-mini futures at 3:30 p.m., 2-hour bars, with volume]
What is the alternative? If the present smaller 4th wave, wave 4{-7}, declines past 5744, then the numbering doesn’t match the chart. The wave would be a subwave of wave of declining wave 3{-7}, which would still be underway.
What does Elliott Wave Theory say? Here are the waves that underlie the morning’s analyses as they appeared on the chart.
Principal Analysis
- Falling wave C{-6} within falling wave 4{-5} continues.
- Rising wave 4{-7} is underway.
Alternative Analysis
- Falling wave 3{-7} is underway.
Long-term Waves.
These are the waves currently in progress under my principal analysis. Each line on the list shows the wave number, with the subscript in curly brackets, the traditional degree name, the starting date, the starting price of the S&P 500 E-mini futures, and the direction of the wave.
- S&P 500 Index:
- 5{+3} Supercycle, 7/8/1932, 4.40 (up)
- 5{+2} Cycle, 12/9/1974, 60.96 (up)
- 5{+1} Primary, 3/6/2009, 666.79 (up)
- 5{0} Intermediate, 2/11/2016, 1810.10 (up)
- 3{-1} Minor, 3/23/2020, 2191.36 (up)
- 3{-2} Minute, 10/13/2022, 3491.58 (up)
- S&P 500 Futures
- 5{-3} Minuette, 4/18/2024, 4963.50 (up)
- 3{-4} Subminuette, 8/7/2024, 5182 (up)
- 4{-5} Micro, 12/16/2025, 6163.75 (down)
- C{-6} Submicro, 2/19/2025, 6166.50 (down)
- 4{-7} (no name), 3/4/2025, 5744 (up)
Reading the chart. Price movements — waves – – in Elliott Wave Theory analysis are labeled with numbers within trending waves and letters with corrective waves. The subscripts — numbers in curly brackets — designate the wave’s degree, which, in Elliott Wave analysis, means the relative position of a wave within the larger and smaller structures that make up the chart. R.N. Elliott, who in the 1930s developed the form of analysis that bears his name, viewed the chart as a complex structure of smaller waves nested within larger waves, which in turn are nested within still larger waves. In mathematics it’s called a fractal structure, where at every scale the pattern is similar to the others.
Learning and other resources. Elliott Wave analysis provides context, not prophecy. As the 20th century semanticist Alfred Korzybski put it in his book Science and Sanity (1933), “The map is not the territory … The only usefulness of a map depends on similarity of structure between the empirical world and the map.” And I would add, in the ever-changing markets, we can judge that similarity of structure only after the fact.
See the menu page Analytical Methods for a rundown on where to go for information on Elliott Wave analysis.
By Tim Bovee, Portland, Oregon, March 6, 2025
Disclaimer
Tim Bovee, Private Trader tracks the analysis and trades of a private trader for his own accounts. Nothing in this blog constitutes a recommendation to buy or sell stocks, options or any other financial instrument. The only purpose of this blog is to provide education and entertainment.
No trader is ever 100 percent successful in his or her trades. Trading in the stock and option markets is risky and uncertain. Each trader must make trading decisions for his or her own account, and take responsibility for the consequences.
All content on Tim Bovee, Private Trader by Timothy K. Bovee is licensed under a Creative Commons Attribution-ShareAlike 4.0 International License.
Based on a work at www.timbovee.com

You must be logged in to post a comment.