3:30 p.m. New York time
Half an hour before the closing bell. The S&P 500 E-mini futures bounced off of its session low, 5509.25, so far coming close to 5560.
Elliott Wave Theory: A 4th wave upward correction began on March 11 from 5534. The first subwave, wave A, ended on March 12, and the declining second subwave, wave B, is nearing its end.
In terms of the chart labeling, where a wave number is followed by a number in curly brackets showing the wave’s position in the fractal structure relative to Intermediate degree, here’s the line-up.
Within rising wave 4{-9}, declining wave B{-10} is underway, and is in its final subwave, wave C{-11}, which in turn is in its final subwave, declining wave 5{-12}, which is in its next-to-the-last subwave, rising wave 4{-13}.
What’s next? Wave 5{-13} will follow, and when it is complete, it will also be the end of three larger waves, wave 5{-12}, wave C{-11} and wave B{-10}.
Rising wave C{-10} will follow and is likely to reach somewhere between 5630 and 5650, based on Fibonacci extensions, although it could go higher, perhaps even reaching 5700. As always with Elliott Wave Theory, time will tell.
I’m leaving this morning’s big-picture chart as it was this morning and here is this afternoon’s chart, a four-day closeup:
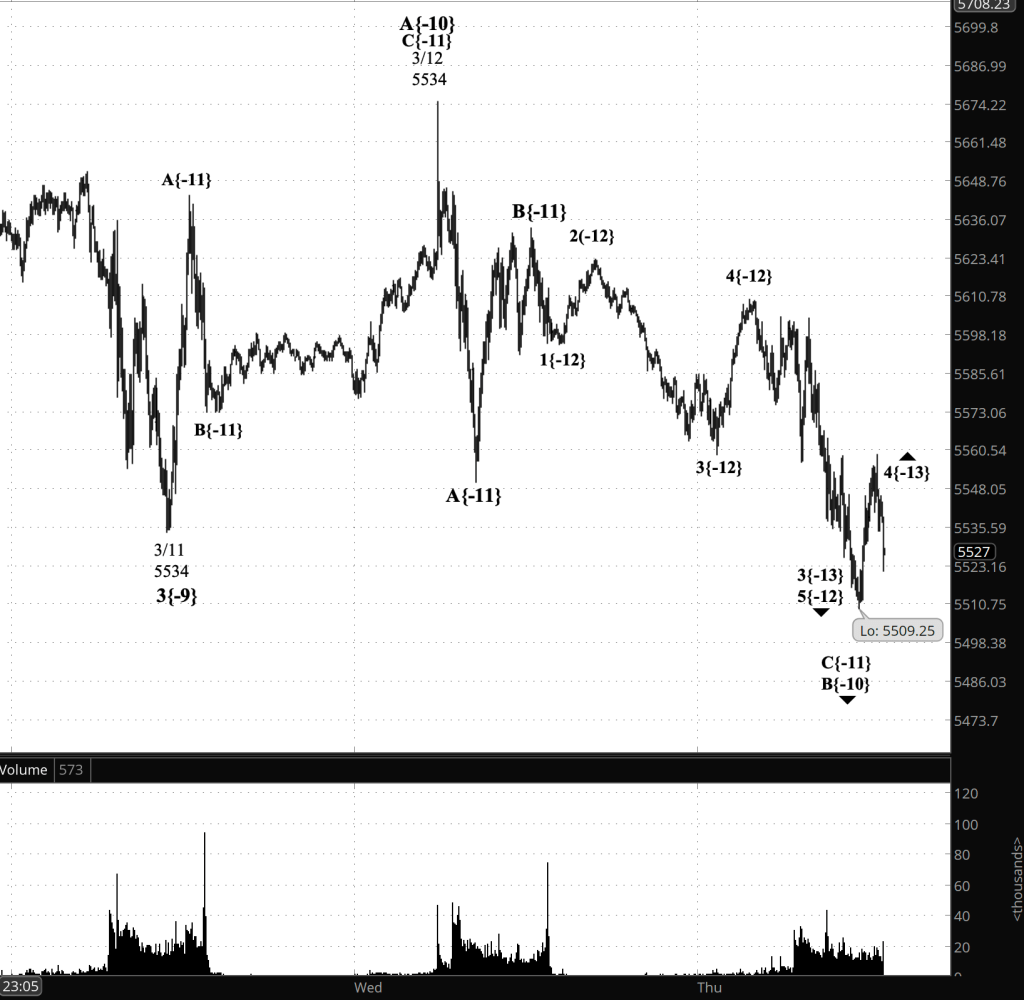
[S&P 500 E-mini futures at 3:30 p.m., 35-minute bars, with volume]
9:43 a.m. New York time
What’s happening now? The S&P 500 E-mini futures see-sawed between the 5650s and the 5530s overnight, shooting up once to 5675 at 5:30 a.m., upon the release of the Producer Price Index. The price quickly retreated.
What does it mean? In this discussion I’ll refer the waves in the form used on the chart: wave number plus location in the fractal structure. See the “Readng the chart” section below.
Through the lens of Elliott Wave theory, the pattern can be seen as two subwaves, waves A{-10} and B{-10}, within a 4th-wave rising correction. Wave 3{-9}, the decline that began on March 7, ended on March 11 at 5534.
Rising wave C{-10} will follow, completing the correction.
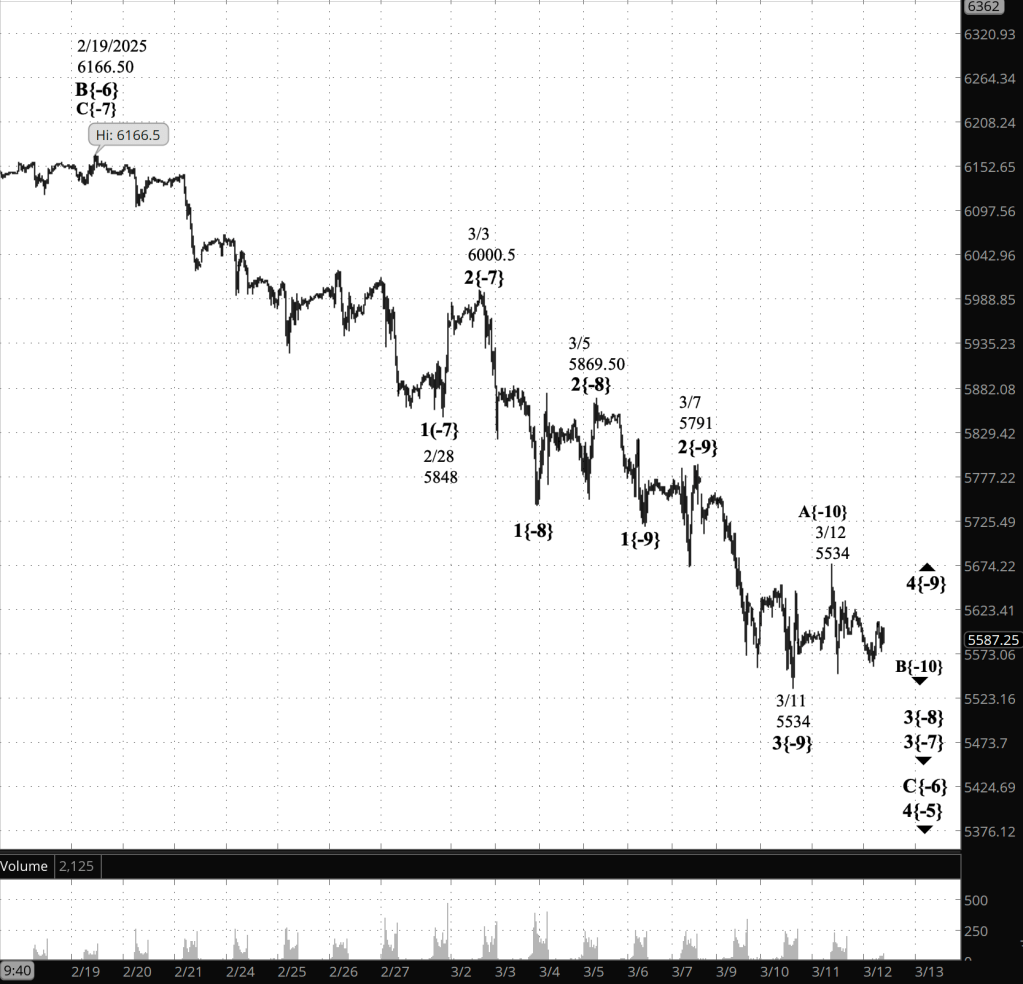
[S&P 500 E-mini futures at 9:37 a.m., 35-minute bars, with volume]
What is the alternative? If the price reverses and moves below 5534, my analysis will show wave 3{-9} still underway, and the upward correction will be demoted to a subwave of wave 3{-9}.
What does Elliott Wave Theory say? Here are the waves that underlie the morning’s analyses as they appeared on the chart.
Principal Analysis
- Falling wave C{-6} within falling wave 4{-5} continues.
- Falling wave 5{-7} is underway.
- When wave 5{-7} ends, it will also be the end of waves C{-6} and 4{-5}.
- Rising wave 5{-5} will begin, likely carrying the price to new heights.
Long-term Waves.
These are the waves currently in progress under my principal analysis. Each line on the list shows the wave number, with the subscript in curly brackets, the traditional degree name, the starting date, the starting price of the S&P 500 E-mini futures, and the direction of the wave.
- S&P 500 Index:
- 5{+3} Supercycle, 7/8/1932, 4.40 (up)
- 5{+2} Cycle, 12/9/1974, 60.96 (up)
- 5{+1} Primary, 3/6/2009, 666.79 (up)
- 5{0} Intermediate, 2/11/2016, 1810.10 (up)
- 3{-1} Minor, 3/23/2020, 2191.36 (up)
- 3{-2} Minute, 10/13/2022, 3491.58 (up)
- S&P 500 Futures
- 5{-3} Minuette, 4/18/2024, 4963.50 (up)
- 3{-4} Subminuette, 8/7/2024, 5182 (up)
- 4{-5} Micro, 12/16/2025, 6163.75 (down)
- C{-6} Submicro, 2/19/2025, 6166.50 (down)
- 5{-7} (no name), 3/3/2025, 6000.50 (down)
- 3{-8} (no name), 3/5/2025, 5869.40 (down)
Reading the chart. Price movements — waves – – in Elliott Wave Theory analysis are labeled with numbers within trending waves and letters with corrective waves. The subscripts — numbers in curly brackets — designate the wave’s degree, which, in Elliott Wave analysis, means the relative position of a wave within the larger and smaller structures that make up the chart. R.N. Elliott, who in the 1930s developed the form of analysis that bears his name, viewed the chart as a complex structure of smaller waves nested within larger waves, which in turn are nested within still larger waves. In mathematics it’s called a fractal structure, where at every scale the pattern is similar to the others.
Learning and other resources. Elliott Wave analysis provides context, not prophecy. As the 20th century semanticist Alfred Korzybski put it in his book Science and Sanity (1933), “The map is not the territory … The only usefulness of a map depends on similarity of structure between the empirical world and the map.” And I would add, in the ever-changing markets, we can judge that similarity of structure only after the fact.
See the menu page Analytical Methods for a rundown on where to go for information on Elliott Wave analysis.
By Tim Bovee, Portland, Oregon, March 13, 2025
Disclaimer
Tim Bovee, Private Trader tracks the analysis and trades of a private trader for his own accounts. Nothing in this blog constitutes a recommendation to buy or sell stocks, options or any other financial instrument. The only purpose of this blog is to provide education and entertainment.
No trader is ever 100 percent successful in his or her trades. Trading in the stock and option markets is risky and uncertain. Each trader must make trading decisions for his or her own account, and take responsibility for the consequences.
All content on Tim Bovee, Private Trader by Timothy K. Bovee is licensed under a Creative Commons Attribution-ShareAlike 4.0 International License.
Based on a work at www.timbovee.com

You must be logged in to post a comment.