3:30 p.m. New York time
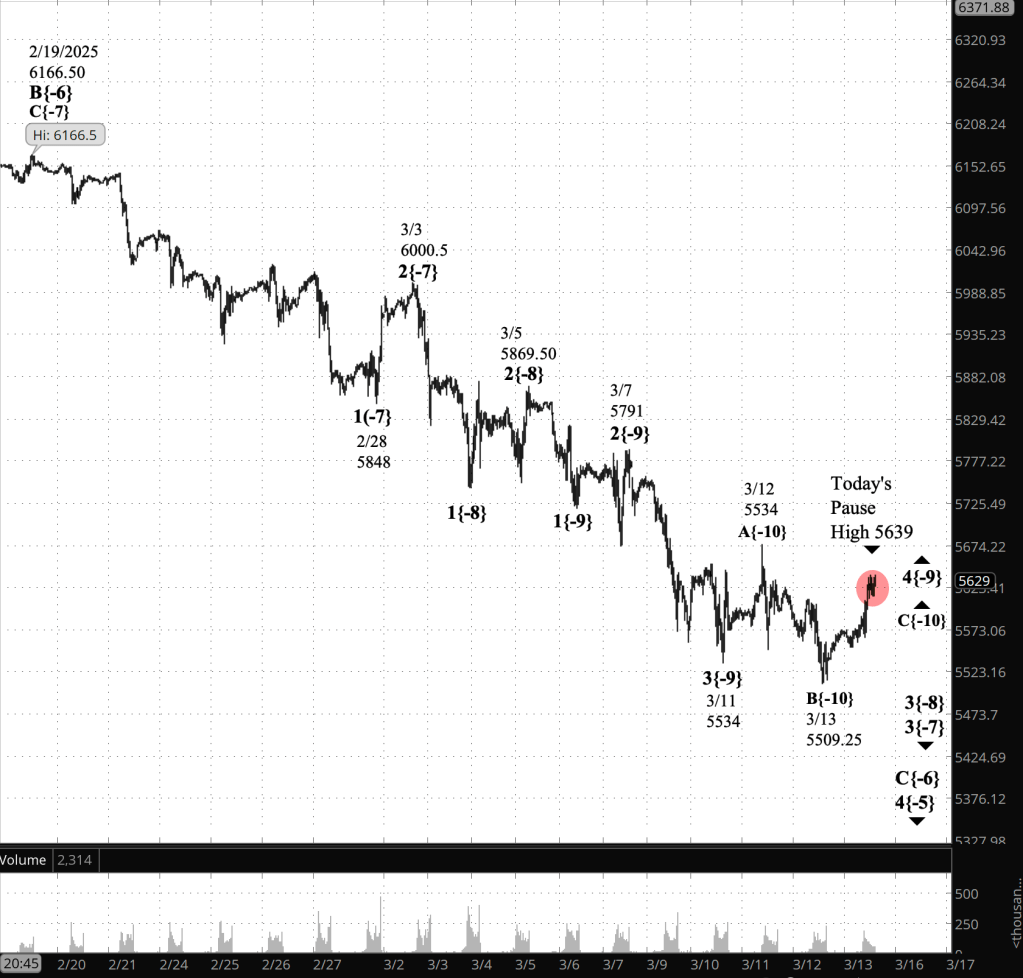
Half an hour before the closing bell. The S&P500 futures reached a high during the session of 5639 and the dropped back slightly.
Elliott Wave Theory. Wave B{-10} on the chart ended on March 13 at 5509.25. Wave C{-10} is underway.
Today’s slight pullback from the session peak is a subwave within wave C, part of a 4th-wave upward correction that began on March 11. The correction appears to be taking the form of an expanded Flat, with each wave having five subwaves.
In my analysis I count wave C as being in its 3rd subwave. The pause during the session may mark the end of the C wave, or maybe not. Impossible to know for sure at this point. In either case, my analysis suggests that there’s still some upside left in wave C.
9:35 a.m. New York time
What’s happening now? The S&P 500 E-mini futures rose overnight, from the 5538.75 just after the closing bell to the 5580s, so far, as the opening bell drew near.
What does it mean? In Elliott Wave Theory, the decline that began on February 19 from 6166.50 is a declining C wave within a 4th-wave downward correction that began on December 16, 2024 from 6163.75.
The low point of the C-wave decline, which is not yet complete, occurred yesterday, March 13, at 5509.25. It is the end of the first subwave within a wave A, the rising first subwave within the 4th-wave upward correction that began on March 11. The falling 2nd subwave is now underway, and it will be followed by a rising 3rd subwave, ending the larger 4th subwave, which is labeled wave 4{-9} on the chart. A declining 5th subwave will follow, bringing the price still lower and the parent 3rd wave to an end.
[S&P 500 E-mini futures at 3:30 p.m., 35-minute bars, with volume]
What is the alternative? None at present.
What does Elliott Wave Theory say? Here are the waves that underlie the morning’s analyses as they appeared on the chart.
Principal Analysis
- Falling wave C{-6} within falling wave 4{-5} continues.
- Falling wave 5{-7} is underway.
- When wave 5{-7} ends, it will also be the end of waves C{-6} and 4{-5}.
- Rising wave 5{-5} will begin, likely carrying the price to new heights.
Long-term Waves.
These are the waves currently in progress under my principal analysis. Each line on the list shows the wave number, with the subscript in curly brackets, the traditional degree name, the starting date, the starting price of the S&P 500 E-mini futures, and the direction of the wave.
- S&P 500 Index:
- 5{+3} Supercycle, 7/8/1932, 4.40 (up)
- 5{+2} Cycle, 12/9/1974, 60.96 (up)
- 5{+1} Primary, 3/6/2009, 666.79 (up)
- 5{0} Intermediate, 2/11/2016, 1810.10 (up)
- 3{-1} Minor, 3/23/2020, 2191.36 (up)
- 3{-2} Minute, 10/13/2022, 3491.58 (up)
- S&P 500 Futures
- 5{-3} Minuette, 4/18/2024, 4963.50 (up)
- 3{-4} Subminuette, 8/7/2024, 5182 (up)
- 4{-5} Micro, 12/16/2025, 6163.75 (down)
- C{-6} Submicro, 2/19/2025, 6166.50 (down)
- 5{-7} (no name), 3/3/2025, 6000.50 (down)
- 3{-8} (no name), 3/5/2025, 5869.40 (down)
Reading the chart. Price movements — waves – – in Elliott Wave Theory analysis are labeled with numbers within trending waves and letters with corrective waves. The subscripts — numbers in curly brackets — designate the wave’s degree, which, in Elliott Wave analysis, means the relative position of a wave within the larger and smaller structures that make up the chart. R.N. Elliott, who in the 1930s developed the form of analysis that bears his name, viewed the chart as a complex structure of smaller waves nested within larger waves, which in turn are nested within still larger waves. In mathematics it’s called a fractal structure, where at every scale the pattern is similar to the others.
Learning and other resources. Elliott Wave analysis provides context, not prophecy. As the 20th century semanticist Alfred Korzybski put it in his book Science and Sanity (1933), “The map is not the territory … The only usefulness of a map depends on similarity of structure between the empirical world and the map.” And I would add, in the ever-changing markets, we can judge that similarity of structure only after the fact.
See the menu page Analytical Methods for a rundown on where to go for information on Elliott Wave analysis.
By Tim Bovee, Portland, Oregon, March 14, 2025
Disclaimer
Tim Bovee, Private Trader tracks the analysis and trades of a private trader for his own accounts. Nothing in this blog constitutes a recommendation to buy or sell stocks, options or any other financial instrument. The only purpose of this blog is to provide education and entertainment.
No trader is ever 100 percent successful in his or her trades. Trading in the stock and option markets is risky and uncertain. Each trader must make trading decisions for his or her own account, and take responsibility for the consequences.
All content on Tim Bovee, Private Trader by Timothy K. Bovee is licensed under a Creative Commons Attribution-ShareAlike 4.0 International License.
Based on a work at www.timbovee.com

You must be logged in to post a comment.