3:30 p.m. New York time
Half an hour before the closing bell. The S&P 500 futures continued to rise during the session, reaching the 5760 region.
Elliott Wave Theory: For this part I’ll use the wave labels as they appear on the chart: A wave number followed by a subscript in curly brackets locating the wave within the fractal structure of the chart. The subscript shows the number of degrees the wave is from Intermediate degree.
Corrective wave 4{-9} and its subwave, C{-10}, continue to rise. I’ve made a change to my understanding of the 4th wave’s internal structure. I had labeled the March 16 turning point, from 5683.75, as the end of wave 3{-12}, a subwave of wave 3{-11}, the middle subwave of wave C{-10}.
Given the pace of the rise, it seems increasingly likely that 5683.75 marks the end wave 3{-11}, and wave 5{-11} is currently underway.
When wave 5{-11} ends, it will also be the end of the parent wave C{-10} and the grandparent wave 4{-9}. A downtrending impulse movement, wave 5{-9}, will commence, carrying the price down for a significant distance.
Hang on! It might be a bumpy ride.
9:35 a.m. New York time
What’s happening now? The S&P 500 E-mini futures rose after trading resumed overnight, from a low point of 5651.50 to above 5700, picking up the pace after the 8:30 a.m. New York time release of the U.S. Retail Sales report.
What does it mean? Elliott Wave Theory analysis shows that the 4th-wave upward correction continues and is in its 3rd subwave, wave C. Internally, things get a bit more complex. Rather than a standard three-wave correction — a Zigzag or a Flat — it could be one of the rarer variants, such as an Extended Flat or a Triangle.
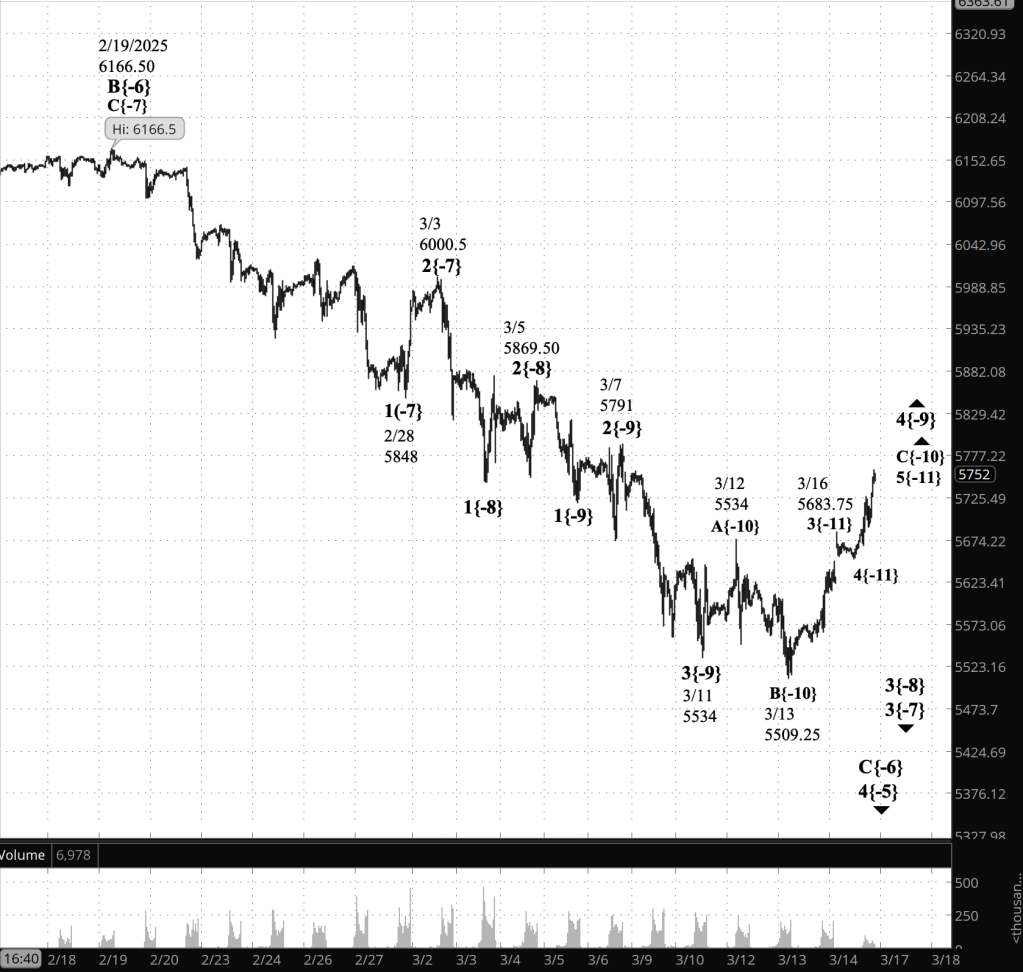
[S&P 500 E-mini futures at 3:30 p.m., 40-minute bars, with volume]
What is the alternative? There are some wave proportion and overlaps that require a closer look; I’ll be working on them today.
What does Elliott Wave Theory say? Here are the waves that underlie the morning’s analyses as they appeared on the chart.
Principal Analysis
- Rising wave 4{-9} is underway and internally is in wave C{-10}.
- Wave C{-10} is in wave 3{-11}, the middle subwave.
- Wave 3{-11} appears to be in its final subwave, wave 5{-12}.
Long-term Waves.
These are the waves currently in progress under my principal analysis. Each line on the list shows the wave number, with the subscript in curly brackets, the traditional degree name, the starting date, the starting price of the S&P 500 E-mini futures, and the direction of the wave.
- S&P 500 Index:
- 5{+3} Supercycle, 7/8/1932, 4.40 (up)
- 5{+2} Cycle, 12/9/1974, 60.96 (up)
- 5{+1} Primary, 3/6/2009, 666.79 (up)
- 5{0} Intermediate, 2/11/2016, 1810.10 (up)
- 3{-1} Minor, 3/23/2020, 2191.36 (up)
- 3{-2} Minute, 10/13/2022, 3491.58 (up)
- S&P 500 Futures
- 5{-3} Minuette, 4/18/2024, 4963.50 (up)
- 3{-4} Subminuette, 8/7/2024, 5182 (up)
- 4{-5} Micro, 12/16/2025, 6163.75 (down)
- C{-6} Submicro, 2/19/2025, 6166.50 (down)
- 5{-7} (no name), 3/3/2025, 6000.50 (down)
- 3{-8} (no name), 3/5/2025, 5869.40 (down)
- 4{-9} (no name), 3/11/2025, 5534 (up)
Reading the chart. Price movements — waves – – in Elliott Wave Theory analysis are labeled with numbers within trending waves and letters with corrective waves. The subscripts — numbers in curly brackets — designate the wave’s degree, which, in Elliott Wave analysis, means the relative position of a wave within the larger and smaller structures that make up the chart. R.N. Elliott, who in the 1930s developed the form of analysis that bears his name, viewed the chart as a complex structure of smaller waves nested within larger waves, which in turn are nested within still larger waves. In mathematics it’s called a fractal structure, where at every scale the pattern is similar to the others.
Learning and other resources. Elliott Wave analysis provides context, not prophecy. As the 20th century semanticist Alfred Korzybski put it in his book Science and Sanity (1933), “The map is not the territory … The only usefulness of a map depends on similarity of structure between the empirical world and the map.” And I would add, in the ever-changing markets, we can judge that similarity of structure only after the fact.
See the menu page Analytical Methods for a rundown on where to go for information on Elliott Wave analysis.
By Tim Bovee, Portland, Oregon, March 17, 2025
Disclaimer
Tim Bovee, Private Trader tracks the analysis and trades of a private trader for his own accounts. Nothing in this blog constitutes a recommendation to buy or sell stocks, options or any other financial instrument. The only purpose of this blog is to provide education and entertainment.
No trader is ever 100 percent successful in his or her trades. Trading in the stock and option markets is risky and uncertain. Each trader must make trading decisions for his or her own account, and take responsibility for the consequences.
All content on Tim Bovee, Private Trader by Timothy K. Bovee is licensed under a Creative Commons Attribution-ShareAlike 4.0 International License.
Based on a work at www.timbovee.com

You must be logged in to post a comment.