3:30 p.m. New York time
Half an hour before the closing bell. The S&P 500 futures gained clarity in today’s session, and the Elliott Wave pattern worked through a 4th-wave downward correction within an uptrending 5th wave.
The correction is now in wave C, nearly always the 3rd and final subwave of a correction. How can it go? The A wave dropped by about 100 points. If the C wave does that, too, then we’re looking in the neighborhood of 5700 or a bit below.
A reminder. There are never guarantees in Elliott Wave Theory analysis. Ambiguity rules on an EWT chart. Which is what makes it challenging.
9:35 a.m. New York time
What’s happening now? The S&P 500 E-mini futures zigzagged overnight, ending up about midway between the night’s extremes.
What does it mean? If the zigging and zagging ends up forming a three-subwave correction — that’s where it is now — then the decline will be followed by a continuation of the 5th-wave rise. If the subwaves form a five-way pattern, then wave 5 has ended and a new downtrend has begun.
A change in the report. I’m eliminating the alternative analysis section. I usually end up discussing it in the “What does it mean section”, making the alternative section redundant.
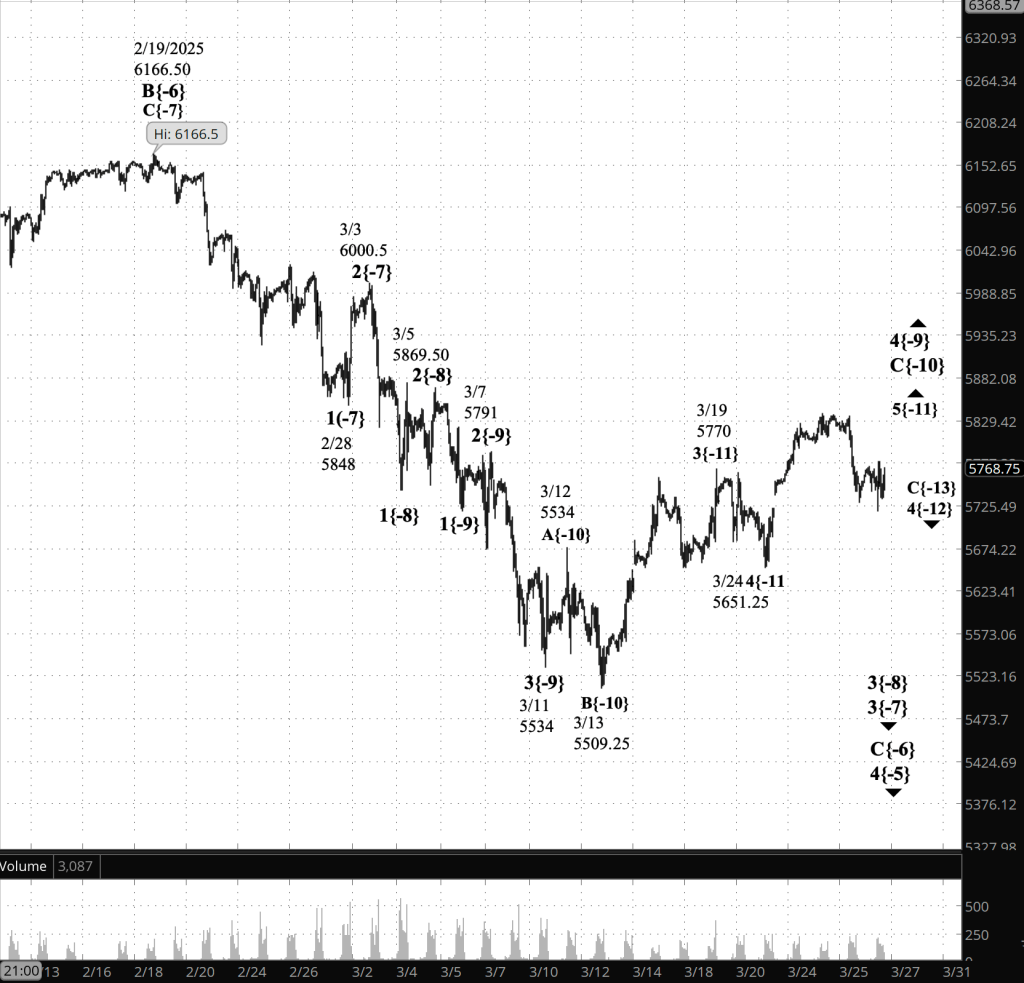
[S&P 500 E-mini futures at 3:30 p.m., hourly bars, with volume]
What does Elliott Wave Theory say? Here are the waves that underlie the morning’s analyses as they appeared on the chart.
Principal Analysis
- Rising wave 4{-9} is underway and internally is in rising wave C{-10}.
- Wave C{-10} is in its final subwave, wave 5{-11}.
- When wave 5{-11} is complete, it will also be the end of wave C{-10} and most likely the end of the 4th wave upward correction, wave 4{-9}.
- When wave 4{-9} is complete, downtrending wave 5{-9} will begin, carrying the price back to the 5530s and most likely lower.
Long-term Waves
These are the waves currently in progress under my principal analysis. Each line on the list shows the wave number, with the subscript in curly brackets, the traditional degree name, the starting date, the starting price of the S&P 500 E-mini futures, and the direction of the wave.
- S&P 500 Index:
- 5{+3} Supercycle, 7/8/1932, 4.40 (up)
- 5{+2} Cycle, 12/9/1974, 60.96 (up)
- 5{+1} Primary, 3/6/2009, 666.79 (up)
- 5{0} Intermediate, 2/11/2016, 1810.10 (up)
- 3{-1} Minor, 3/23/2020, 2191.36 (up)
- 3{-2} Minute, 10/13/2022, 3491.58 (up)
- S&P 500 Futures
- 5{-3} Minuette, 4/18/2024, 4963.50 (up)
- 3{-4} Subminuette, 8/7/2024, 5182 (up)
- 4{-5} Micro, 12/16/2024, 6163.75 (down)
- C{-6} Submicro, 2/19/2025, 6166.50 (down)
- 5{-7} (no name), 3/3/2025, 6000.50 (down)
- 3{-8} (no name), 3/5/2025, 5869.40 (down)
- 4{-9} (no name), 3/11/2025, 5534 (up)
Reading the chart. Price movements — waves – – in Elliott Wave Theory analysis are labeled with numbers within trending waves and letters with corrective waves. The subscripts — numbers in curly brackets — designate the wave’s degree, which, in Elliott Wave analysis, means the relative position of a wave within the larger and smaller structures that make up the chart. R.N. Elliott, who in the 1930s developed the form of analysis that bears his name, viewed the chart as a complex structure of smaller waves nested within larger waves, which in turn are nested within still larger waves. In mathematics it’s called a fractal structure, where at every scale the pattern is similar to the others.
Learning and other resources. Elliott Wave analysis provides context, not prophecy. As the 20th century semanticist Alfred Korzybski put it in his book Science and Sanity (1933), “The map is not the territory … The only usefulness of a map depends on similarity of structure between the empirical world and the map.” And I would add, in the ever-changing markets, we can judge that similarity of structure only after the fact.
See the menu page Analytical Methods for a rundown on where to go for information on Elliott Wave analysis.
By Tim Bovee, Portland, Oregon, March 27, 2025
Disclaimer
Tim Bovee, Private Trader tracks the analysis and trades of a private trader for his own accounts. Nothing in this blog constitutes a recommendation to buy or sell stocks, options or any other financial instrument. The only purpose of this blog is to provide education and entertainment.
No trader is ever 100 percent successful in his or her trades. Trading in the stock and option markets is risky and uncertain. Each trader must make trading decisions for his or her own account, and take responsibility for the consequences.
All content on Tim Bovee, Private Trader by Timothy K. Bovee is licensed under a Creative Commons Attribution-ShareAlike 4.0 International License.
Based on a work at www.timbovee.com

You must be logged in to post a comment.