3:30 p.m. New York time
Half an hour before the closing bell. The S&P 500 futures fell sharply during the session. The new analytical revisions under Elliott Wave Theory are as follows:
- Wave A within the 4th-wave upward correction that began on April 7 turns out to have three subwaves, making a Flat corrective pattern.
- The immediate and rapid fall form the A-wave peak is wave B, now underway.
- Wave B, when complete, will be followed by rising wave C.
- When wave C is complete, it will also be the end of wave A, one degree higher in the fractal structure.
- The chart labels are: Corrective wave 4{-8}, larger wave A{-9}, subwaves A(-10) (complete), B{-10} (underway) and C{-10} (in the future).
9:35 a.m. New York time
What’s happening now. The S&P 500 E-mini futures began overnight trading from 5115 and has risen so far to the 5250s. The decline that began on April 2 from 5773.25 ended on April 7 at 4832, for a total drop of 16.3%
What does it mean? Elliott Wave Theory sees the decline from April 2 as a downtrending 3rd wave. The rise that followed is the start of a 4th-wave upward correction and its initial subwave, risng wave
A. Within wave A, a rising smaller 3rd wave is in progress.
I’ve placed a Fibonacci retracement ladder on the chart, in read, to trace thr 4th-wave’s retracement of the preceding 3rd wave, the sharp decline that began on April 2. The first subwave, rising wave 1, almost reached the 50% retracement level before reversing and falling. The middle subwave, rising wave 3, so far has breezed past the 32.6% retracement level and is approaching the 50% level.
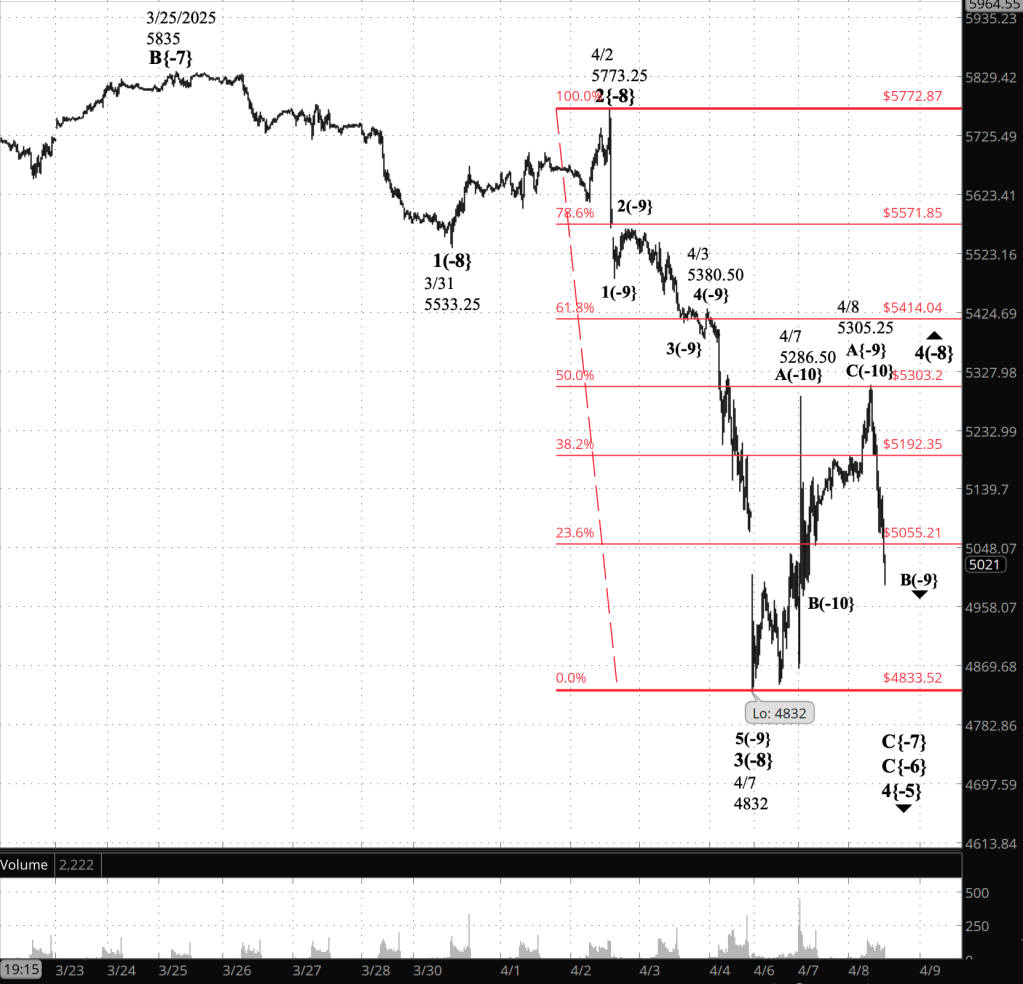
[S&P 500 E-mini futures at 9:35 a.m, 20-minute bars, with volume]
Elliott Wave Theory wave labels. Each wave listed on the charts has two components: A wave number, and a subscript in curly brackets that place the wave’s position in the fractal strucutre in relationship to Intermediate degree. The present Intermediate degree, wave 5{0}, began its rise on February 11, 2016 from 1810.10 and is still underway.
The waves referred to above are as follows. Rising wave 4{-8} is underway, a subwave of wave C{-7}, also declining, which in turn is a subwave of declining wave C{-6}, with both C waves encompassed by declining wave 4{-5}, which began on December 16, 2024.
Within wave 4{-8}, wave A{-9} is underway and within it, wave 3{-10} is in progress.
Long-term Waves
These are the waves currently in progress under my principal analysis. Each line on the list shows the wave number, with the subscript in curly brackets, the traditional degree name, the starting date, the starting price of the S&P 500 E-mini futures, and the direction of the wave. [Updated to match the 7:08 p.m. analysis.)
- S&P 500 Index:
- 5{+3} Supercycle, 7/8/1932, 4.40 (up)
- 5{+2} Cycle, 12/9/1974, 60.96 (up)
- 5{+1} Primary, 3/6/2009, 666.79 (up)
- 5{0} Intermediate, 2/11/2016, 1810.10 (up)
- 3{-1} Minor, 3/23/2020, 2191.36 (up)
- 3{-2} Minute, 10/13/2022, 3491.58 (up)
- S&P 500 Futures
- 5{-3} Minuette, 4/18/2024, 4963.50 (up)
- 3{-4} Subminuette, 8/7/2024, 5182 (up)
- 4{-5} Micro, 12/16/2024, 6163.75 (down)
- C{-6} Submicro, 2/19/2025, 6166.50 (down)
- C{-7} Minuscule, 3/25/2025, 5835 (down)
Reading the chart. Price movements — waves – – in Elliott Wave Theory analysis are labeled with numbers within trending waves and letters with corrective waves. The subscripts — numbers in curly brackets — designate the wave’s degree, which, in Elliott Wave analysis, means the relative position of a wave within the larger and smaller structures that make up the chart. R.N. Elliott, who in the 1930s developed the form of analysis that bears his name, viewed the chart as a complex structure of smaller waves nested within larger waves, which in turn are nested within still larger waves. In mathematics it’s called a fractal structure, where at every scale the pattern is similar to the others.
Learning and other resources. Elliott Wave analysis provides context, not prophecy. As the 20th century semanticist Alfred Korzybski put it in his book Science and Sanity (1933), “The map is not the territory … The only usefulness of a map depends on similarity of structure between the empirical world and the map.” And I would add, in the ever-changing markets, we can judge that similarity of structure only after the fact.
See the menu page Analytical Methods for a rundown on where to go for information on Elliott Wave analysis.
By Tim Bovee, Portland, Oregon, April 8 2025
Disclaimer
Tim Bovee, Private Trader tracks the analysis and trades of a private trader for his own accounts. Nothing in this blog constitutes a recommendation to buy or sell stocks, options or any other financial instrument. The only purpose of this blog is to provide education and entertainment.
No trader is ever 100 percent successful in his or her trades. Trading in the stock and option markets is risky and uncertain. Each trader must make trading decisions for his or her own account, and take responsibility for the consequences.
All content on Tim Bovee, Private Trader by Timothy K. Bovee is licensed under a Creative Commons Attribution-ShareAlike 4.0 International License.
Based on a work at www.timbovee.com

You must be logged in to post a comment.