3:30 p.m. New York time
Half an hour before the closing bell. The rise of the S&P 500 futures that began shortly before the opening bell from 5521.50 has continued during the session, so far reaching a high of 5597.25
Elliott Wave Theory: The rising C wave that began on April 21 continues, albeit at a snail’s pace.
The end of the C wave will also be the end of the parent 4th-wave upward correction, and the beginning of a 5th wave that will produce a significant decline.
9:35 a.m. New York time
What’s happening now. The S&P 500 E-mini futures fluctuated mainly between the 5540s and the 5560s overnnight, with occasional forays beyond in either direction. In other words, more of the same.
The price dropped into the 5520s in the minutes before the opening bell sounded.
What does it mean? The Elliott Wave Theory analysis remains unchanged. The final subwave — wave C — within the 4th-wave upward correction that began on April 7 continues.
Elliott waves reflect the hopes and fears — the mood — of people. And this week and the two weeks that follow it will have plenty to trigger a change of mood.
So far we haven’t had major economic reports that track the economy in April. President Trump after the market close on April 7 announced his extensive tariffs policy, the market fell dramatically, amid fears of inflation and stagflation and other negative impacts.
On Wednesday, April 30, we’ll start to get economic data that tells us what the true impact of the policy was in the month it was announced. Here’s a list (times are New York time).
- The ADP employment report, Wednesday, April. 30, 8:15 a.m.
- A sneak preview of the government’s employment report,
- Gross Domestic Product for the first quarter, Wednesday, April 30, 8:30 a.m.
- How’s the economy doing overall? Making money, or losing it?
- The government’s Employment Situation Report, Friday, May 2, 8:30 a.m.
- This triggers the Sahm Rule, which gives an early warning of whether we are in a recession or not.
- Federal Open Market Committee statement, Wednesday, May 7, 2 p.m.
- Announces whether interest rates will be lowered.
- Consumer Price Index (inflation), Tuesday, May 13, 8:30 p.m.
- Inflation.
That should be enough to keep traders hopping as they respond to events.
In terms of Elliott Wave Theory, the chart will reflect the social mood before each announcement. Presently, the S&P 500 futures are rising, although tentatively, which to me looks very much like worried optimism with a dash of skepticism.
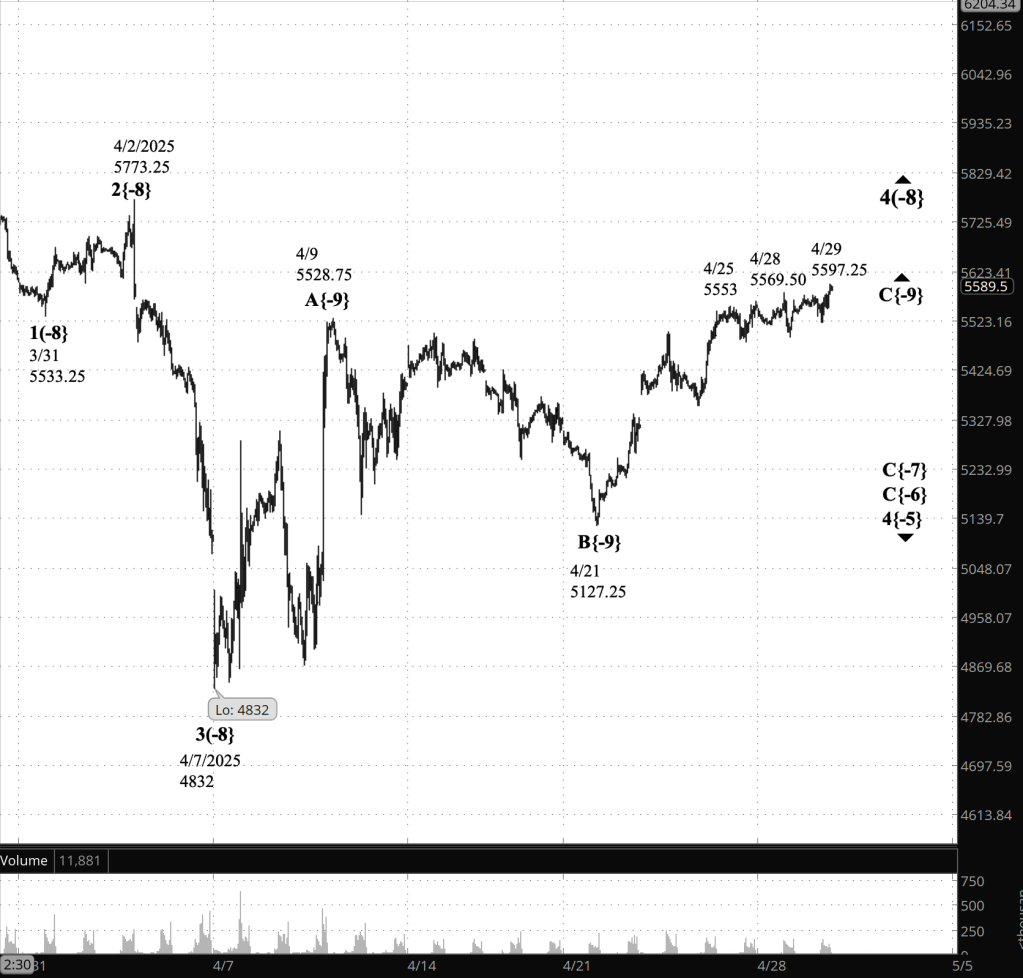
[S&P 500 E-mini futures at 3:30 p.m, 45-minute bars, with volume]
Elliott Wave Theory wave labels. Each wave listed on the charts has two components: A wave number, and a subscript in curly brackets that place the wave’s position in the fractal strucutre in relationship to Intermediate degree. The present Intermediate degree, wave 5{0}, began its rise on February 11, 2016 from 1810.10 and is still underway.
The waves referred to on the chart are as follows.
Principal analysis: Upward correction wave 4{-8} is underway and is in its final subwave, wave C{-9}., having paused for corrective wave 4{-10}. Wave 5{-10} has begun.
Long-term Waves
These are the waves currently in progress under my principal analysis. Each line on the list shows the wave number, with the subscript in curly brackets, the traditional degree name, the starting date, the starting price of the S&P 500 E-mini futures, and the direction of the wave.
- S&P 500 Index:
- 5{+3} Supercycle, 7/8/1932, 4.40 (up)
- 5{+2} Cycle, 12/9/1974, 60.96 (up)
- 5{+1} Primary, 3/6/2009, 666.79 (up)
- 5{0} Intermediate, 2/11/2016, 1810.10 (up)
- 3{-1} Minor, 3/23/2020, 2191.36 (up)
- 3{-2} Minute, 10/13/2022, 3491.58 (up)
- S&P 500 Futures
- 5{-3} Minuette, 4/18/2024, 4963.50 (up)
- 3{-4} Subminuette, 8/7/2024, 5182 (up)
- 4{-5} Micro, 12/16/2024, 6163.75 (down)
- C{-6} Submicro, 2/19/2025, 6166.50 (down)
- C{-7} Minuscule, 3/25/2025, 5835 (down)
- 4{-8} (no name), 3/7/2025, 48322 (up)
- C{-9} (no name), 4/21/2025, 5127.25 (up)
Reading the chart. Price movements — waves – – in Elliott Wave Theory analysis are labeled with numbers within trending waves and letters with corrective waves. The subscripts — numbers in curly brackets — designate the wave’s degree, which, in Elliott Wave analysis, means the relative position of a wave within the larger and smaller structures that make up the chart. R.N. Elliott, who in the 1930s developed the form of analysis that bears his name, viewed the chart as a complex structure of smaller waves nested within larger waves, which in turn are nested within still larger waves. In mathematics it’s called a fractal structure, where at every scale the pattern is similar to the others.
Learning and other resources. Elliott Wave analysis provides context, not prophecy. As the 20th century semanticist Alfred Korzybski put it in his book Science and Sanity (1933), “The map is not the territory … The only usefulness of a map depends on similarity of structure between the empirical world and the map.” And I would add, in the ever-changing markets, we can judge that similarity of structure only after the fact.
See the menu page Analytical Methods for a rundown on where to go for information on Elliott Wave analysis.
By Tim Bovee, Portland, Oregon, April 29, 2025
Disclaimer
Tim Bovee, Private Trader tracks the analysis and trades of a private trader for his own accounts. Nothing in this blog constitutes a recommendation to buy or sell stocks, options or any other financial instrument. The only purpose of this blog is to provide education and entertainment.
No trader is ever 100 percent successful in his or her trades. Trading in the stock and option markets is risky and uncertain. Each trader must make trading decisions for his or her own account, and take responsibility for the consequences.
All content on Tim Bovee, Private Trader by Timothy K. Bovee is licensed under a Creative Commons Attribution-ShareAlike 4.0 International License.
Based on a work at www.timbovee.com

You must be logged in to post a comment.