3:30 p.m. New York time
Half an hour before the closing bell. The S&P 500 futures hit a low for the day of 5455.50 early in the session, and then climbed back into the 5570s.
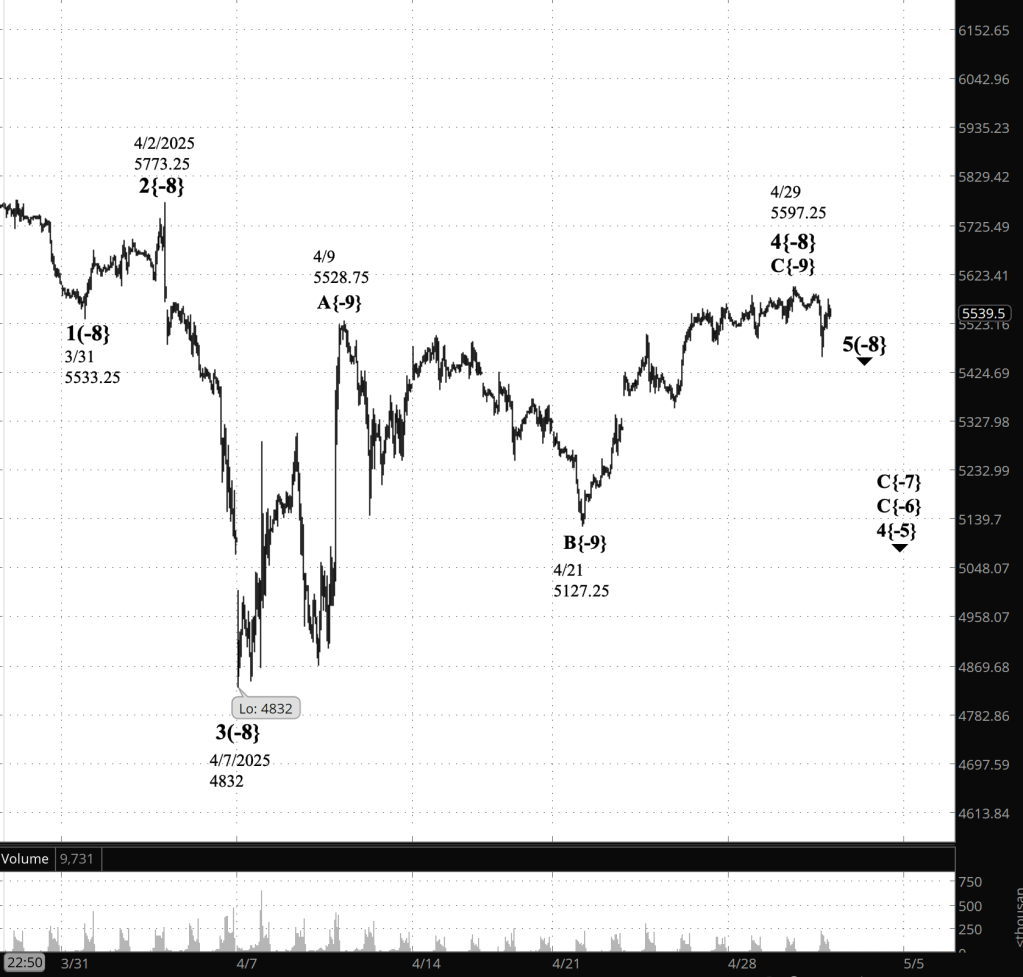
Elliott Wave Theory: The small upward correction within the downtrending 5th wave that began on April 29 continues.
9:35 a.m. New York time
What’s happening now. The S&P 500 E-mini futures dropped sharply when the 1st quarter GDP was published, the steepest decline since 2022. So far the low point is 5497.50.
What does it mean? Filtered through the lens of Elliott Wave Theory, the decline, which began on April 29, before the GDP release, appears to be the end of wave 4 and the early stage of wave 5. I’ve adopted the wave 5 scenario as my principal analysis.
It is quite possible that an alternative analysis is the how the chart will play out. Under this scenario, the 4th wave upward correction that began on April 7 continues and is in its final subwave, wave C,
Often when major economic data is released, the price will whipsaw: Drop or rise sharply and then work its back almost immediately to the price level from which the movement began.
One argument in favor of the 5th-wave scenario is that the price hasn’t whipsawed. It fell, and so far at least, has remained at the lower level.
[S&P 500 E-mini futures at 3:00 p.m, 45-minute bars, with volume]
Elliott Wave Theory wave labels. Each wave listed on the charts has two components: A wave number, and a subscript in curly brackets that place the wave’s position in the fractal strucutre in relationship to Intermediate degree. The present Intermediate degree, wave 5{0}, began its rise on February 11, 2016 from 1810.10 and is still underway.
The waves referred to on the chart are as follows:
Principal analysis: Upward correction wave 4{-8} and its final subwave, wave C{-9}., ended on April 29. Downtrending wave 5{-9} has begun.
Long-term Waves
These are the waves currently in progress under my principal analysis. Each line on the list shows the wave number, with the subscript in curly brackets, the traditional degree name, the starting date, the starting price of the S&P 500 E-mini futures, and the direction of the wave.
- S&P 500 Index:
- 5{+3} Supercycle, 7/8/1932, 4.40 (up)
- 5{+2} Cycle, 12/9/1974, 60.96 (up)
- 5{+1} Primary, 3/6/2009, 666.79 (up)
- 5{0} Intermediate, 2/11/2016, 1810.10 (up)
- 3{-1} Minor, 3/23/2020, 2191.36 (up)
- 3{-2} Minute, 10/13/2022, 3491.58 (up)
- S&P 500 Futures
- 5{-3} Minuette, 4/18/2024, 4963.50 (up)
- 3{-4} Subminuette, 8/7/2024, 5182 (up)
- 4{-5} Micro, 12/16/2024, 6163.75 (down)
- C{-6} Submicro, 2/19/2025, 6166.50 (down)
- C{-7} Minuscule, 3/25/2025, 5835 (down)
- 5{-8} (no name), 4/29/2025, 5597.25 (down)
- 1{-9} (no name), 4/29/2025, 5597.25 (down)
Reading the chart. Price movements — waves – – in Elliott Wave Theory analysis are labeled with numbers within trending waves and letters with corrective waves. The subscripts — numbers in curly brackets — designate the wave’s degree, which, in Elliott Wave analysis, means the relative position of a wave within the larger and smaller structures that make up the chart. R.N. Elliott, who in the 1930s developed the form of analysis that bears his name, viewed the chart as a complex structure of smaller waves nested within larger waves, which in turn are nested within still larger waves. In mathematics it’s called a fractal structure, where at every scale the pattern is similar to the others.
Learning and other resources. Elliott Wave analysis provides context, not prophecy. As the 20th century semanticist Alfred Korzybski put it in his book Science and Sanity (1933), “The map is not the territory … The only usefulness of a map depends on similarity of structure between the empirical world and the map.” And I would add, in the ever-changing markets, we can judge that similarity of structure only after the fact.
See the menu page Analytical Methods for a rundown on where to go for information on Elliott Wave analysis.
By Tim Bovee, Portland, Oregon, April 30, 2025
Disclaimer
Tim Bovee, Private Trader tracks the analysis and trades of a private trader for his own accounts. Nothing in this blog constitutes a recommendation to buy or sell stocks, options or any other financial instrument. The only purpose of this blog is to provide education and entertainment.
No trader is ever 100 percent successful in his or her trades. Trading in the stock and option markets is risky and uncertain. Each trader must make trading decisions for his or her own account, and take responsibility for the consequences.
All content on Tim Bovee, Private Trader by Timothy K. Bovee is licensed under a Creative Commons Attribution-ShareAlike 4.0 International License.
Based on a work at www.timbovee.com

You must be logged in to post a comment.