3:30 p.m. New York time
Half an hour before the closing bell. As the closing bell drew near, the S&P 500 futures resolved the ambiguity discussed in this morning’s analysis.,
Rising wave B within the 4th-wave downward correction that began on June 5 from 6016.50 is underway. Wave C has not yet begun.
The ambiguity was erased about an hour and a half before the session end when the price moved above the June 5th starting point of the correction and its initial subwave, declining wave A.
The correction is a Flat, meaning wave C under the rules is free to exceed the start of the preceding A wave. If it were a Zigzag pattern, the rise would violate a rule of Elliott Wave Theory, but such was not the case.
9:35 a.m. New York time.
What’s happening now. The S&P 500 E-mini futures traded narrowly after trading resumed overnight, opening in the 6010s, dropping in to the 5990s, and the rising to with 25 cents of 6020.
What does it mean? Elliott Wave Theory: The futures, in wave B of a 4th-wave downward correction, closed the week by retracing 100% of previous A wave, which began its decline on June 5 from 6016.50 and spenr the overnight trading failing to break through that level.
A compelling alternative analysis, marked on the chart in red, sees wave B as having ended on June 6 and declining wave C as having begun from that point, 6025. If the price breaks above 6025, then wave B is still underway. If the price stays below 6025 and continues to decline, then wave C is underway. If it is typical, it will likely end somewhere between the 5930s and the 5870s.
All of this was written before the opening bell, when the price fell rapidly below 6004, lending greater credence to the alternative analysis.
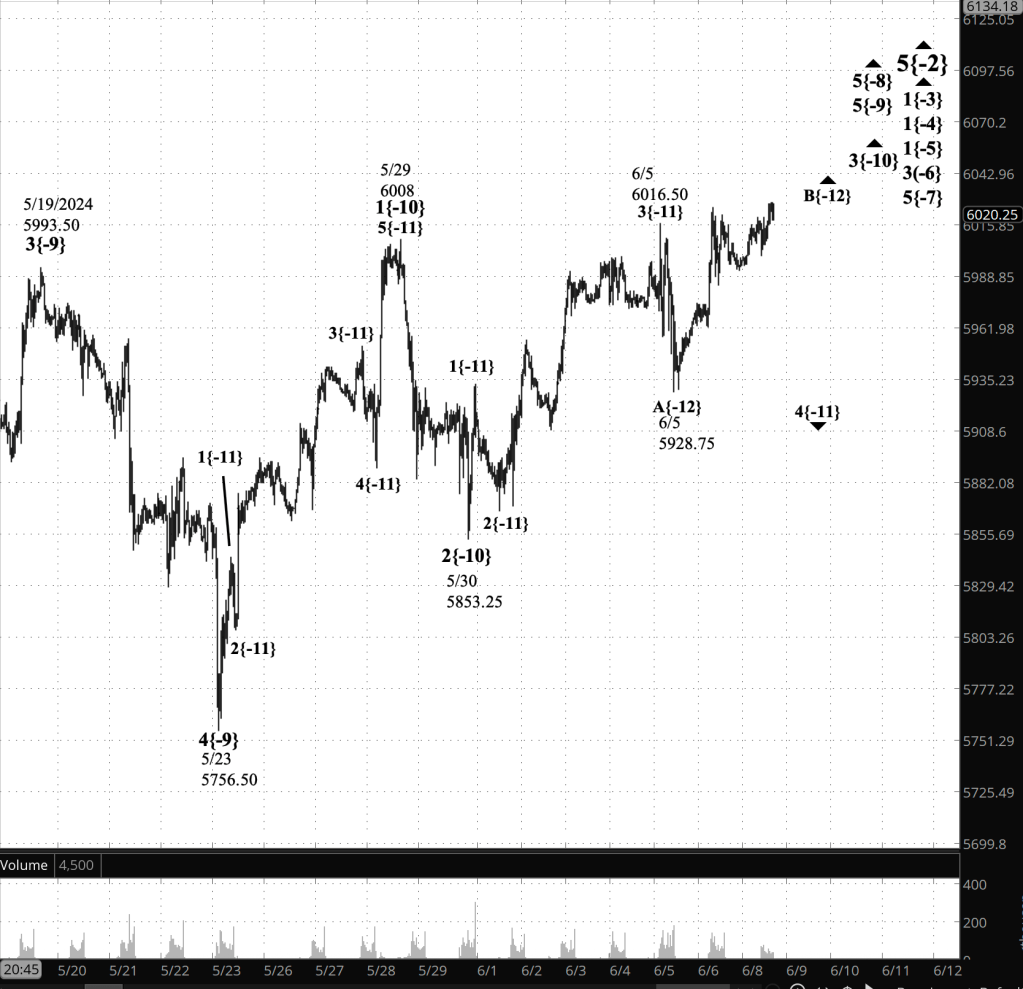
[S&P 500 E-mini futures at 3:30 p.m., 35-minute bars, with volume]
Elliott Wave Theory wave labels. Each wave listed on the charts has two components: A wave number, and a subscript in curly brackets that place the wave’s position in the fractal strucutre in relationship to Intermediate degree. The present Intermediate degree, wave 5{0}, began its rise on February 11, 2016 from 1810.10 and is still underway.
The waves referred to on the chart are as follows.
Principal analysis: Upward correction wave 5{-2} is underway and within it is working through a nested series of initial subwaves, wave 1{-3} down to wave 1{-5}. One degree lower, rising wave 3{-6} is underway and is in its final subwave, wave 5{-7},
Within wave 5{-7}, uptrending wave 5{-8} is in its final stage, uptrending wave 5{-9}.
Within wave 5{-9}, its middle subwave, wave 3{-10}, is underway. Internally, wave 3{-10} is in its 4th subwave, wave 4{-11}, a downward correction that began from 6016.50.
Wave 4{-11} is in its 2nd subwave, rising wave B{-12}.
Waves Now Underway
These are the waves currently in progress under my principal analysis. Each line on the list shows the wave number, with the subscript in curly brackets, the traditional degree name, the starting date, the starting price of the S&P 500 E-mini futures, and the direction of the wave.
- S&P 500 Index:
- 5{+3} Supercycle, 7/8/1932, 4.40 (up)
- 5{+2} Cycle, 12/9/1974, 60.96 (up)
- 5{+1} Primary, 3/6/2009, 666.79 (up)
- 5{0} Intermediate, 2/11/2016, 1810.10 (up)
- 3{-1} Minor, 3/23/2020, 2191.36 (up)
- 5{-2} Minute, 4/7/2025, 4832 (up)
- S&P 500 Futures
- 1{-3} Minuette, 4/7/2025, 4832 (up)
- 1{-4} Subminuette, 4/7/2025, 4832 (up)
- 1{-5} Micro, 4/7/2025, 4832 (up)
- 3{-6} Submicro, 4/21/2025, 4832 (up)
Reading the chart. Price movements — waves – – in Elliott Wave Theory analysis are labeled with numbers within trending waves and letters with corrective waves. The subscripts — numbers in curly brackets — designate the wave’s degree, which, in Elliott Wave analysis, means the relative position of a wave within the larger and smaller structures that make up the chart. R.N. Elliott, who in the 1930s developed the form of analysis that bears his name, viewed the chart as a complex structure of smaller waves nested within larger waves, which in turn are nested within still larger waves. In mathematics it’s called a fractal structure, where at every scale the pattern is similar to the others.
Learning and other resources. Elliott Wave analysis provides context, not prophecy. As the 20th century semanticist Alfred Korzybski put it in his book Science and Sanity (1933), “The map is not the territory … The only usefulness of a map depends on similarity of structure between the empirical world and the map.” And I would add, in the ever-changing markets, we can judge that similarity of structure only after the fact.
See the menu page Analytical Methods for a rundown on where to go for information on Elliott Wave analysis.
By Tim Bovee, Portland, Oregon, June 9, 2025
Disclaimer
Tim Bovee, Private Trader tracks the analysis and trades of a private trader for his own accounts. Nothing in this blog constitutes a recommendation to buy or sell stocks, options or any other financial instrument. The only purpose of this blog is to provide education and entertainment.
No trader is ever 100 percent successful in his or her trades. Trading in the stock and option markets is risky and uncertain. Each trader must make trading decisions for his or her own account, and take responsibility for the consequences.
All content on Tim Bovee, Private Trader by Timothy K. Bovee is licensed under a Creative Commons Attribution-ShareAlike 4.0 International License.
Based on a work at www.timbovee.com.

You must be logged in to post a comment.