3:30 p.m. New York time
Half an hour before the closing bell. The S&P 500 futures continued falling during the session, reaching into the 5980s.
Elliott Wave Theory: The reversal has traveled far enough to add credence to this wave line-up: Declining wave 5, the final subwave within declining wave C, which in turn is the final subwave within declining wave 4 are all underway.
I’ve changed the mark-up of the chart to confirm and will post a new chart, leaving intact the old chart and this morning’s mark-up intact.
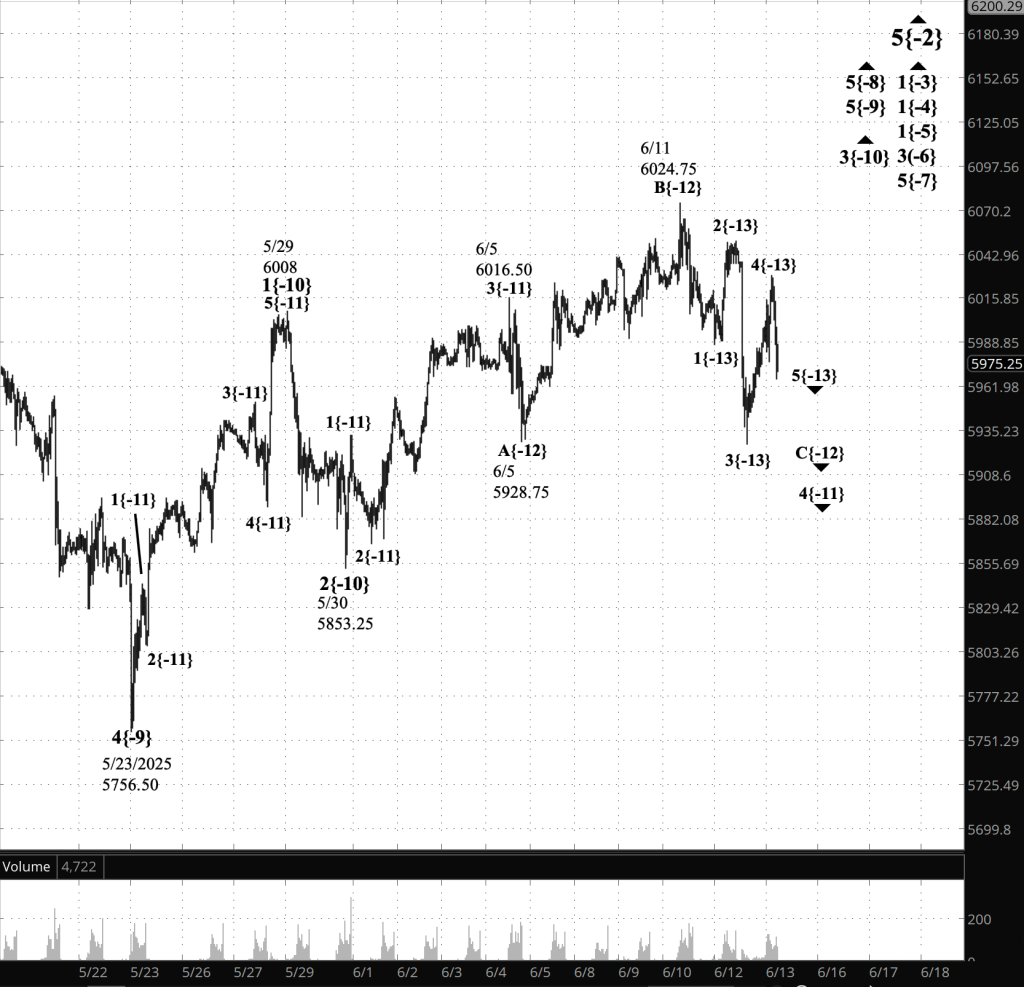
[S&P 500 E-mini futures at 3:30 p.m., 40-minute bars, with volume]
9:35 a.m. New York time.
What’s happening now. The S&P 500 E-mini futures hit a low yesterday evening, several hours after the closing bell. The price reversed at 5927.50 and has kept rising, so far reaching slightly above 6,000.
What does it mean? The fall and rise are all happening within wave C, the final subwave within the 4th-wave downward correction that began on June 5, Elliott Wave Theory analysis shows. Wave C will have five subwaves when complete. Yesterday’s fall was wave 3, the middle subwave within wave C. The reversal and rise overnight is rising wave 4 within wave C.
When wave 4 is complete, it will be followed by wave 5, the final subwave within wave C. The 5th wave will likely carry the price beyond last night’s low, perhaps significantly so. Or not. Fifth waves are quirky and sometimes fall short of the end of wave 3.
Long or short, wave 5 will be the end of its parent C wave and its grandparent 4th wave, and will be the beginning wave a rising 5th wave that will carry the price well into the 6000s.
[Note: The analysis on this morning’s chart, below, has changed considerably during the session. See the new analysis in the afternoon chart, above.]
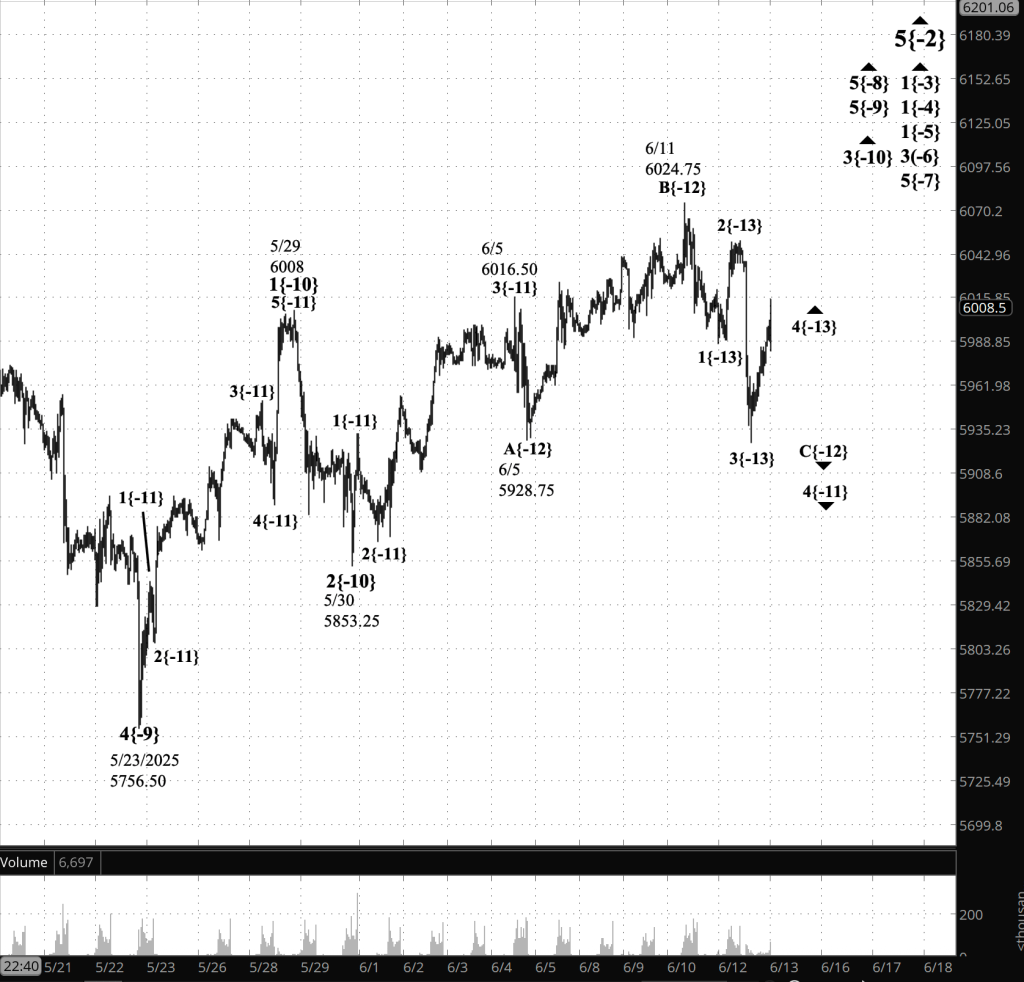
[S&P 500 E-mini futures at 9:35 a.m., 40-minute bars, with volume]
Elliott Wave Theory wave labels. Each wave listed on the charts has two components: A wave number, and a subscript in curly brackets that place the wave’s position in the fractal strucutre in relationship to Intermediate degree. The present Intermediate degree, wave 5{0}, began its rise on February 11, 2016 from 1810.10 and is still underway.
The waves referred to on the chart are as follows.
Principal analysis: Upward correction wave 5{-2} is underway and within it is working through a nested series of initial subwaves, wave 1{-3} down to wave 1{-5}. One degree lower, rising wave 3{-6} is underway and is in its final subwave, wave 5{-7},
Within wave 5{-7}, uptrending wave 5{-8} is in its final stage, uptrending wave 5{-9}.
Within wave 5{-9}, its middle subwave, wave 3{-10}, is underway. Internally, wave 3{-10} is in its next to the last subwave, wave 4{-11}, a downward correction that began from 6016.50.
Wave 4{-11} is in its final subwave, declining wave C{-12}, which is in its next-to-the-last subwave, wave 4{-13}.d
Waves Now Underway
These are the waves currently in progress under my principal analysis. Each line on the list shows the wave number, with the subscript in curly brackets, the traditional degree name, the starting date, the starting price of the S&P 500 E-mini futures, and the direction of the wave.
- S&P 500 Index:
- 5{+3} Supercycle, 7/8/1932, 4.40 (up)
- 5{+2} Cycle, 12/9/1974, 60.96 (up)
- 5{+1} Primary, 3/6/2009, 666.79 (up)
- 5{0} Intermediate, 2/11/2016, 1810.10 (up)
- 3{-1} Minor, 3/23/2020, 2191.36 (up)
- 5{-2} Minute, 4/7/2025, 4832 (up)
- S&P 500 Futures
- 1{-3} Minuette, 4/7/2025, 4832 (up)
- 1{-4} Subminuette, 4/7/2025, 4832 (up)
- 1{-5} Micro, 4/7/2025, 4832 (up)
- 3{-6} Submicro, 4/21/2025, 4832 (up)
Reading the chart. Price movements — waves – – in Elliott Wave Theory analysis are labeled with numbers within trending waves and letters with corrective waves. The subscripts — numbers in curly brackets — designate the wave’s degree, which, in Elliott Wave analysis, means the relative position of a wave within the larger and smaller structures that make up the chart. R.N. Elliott, who in the 1930s developed the form of analysis that bears his name, viewed the chart as a complex structure of smaller waves nested within larger waves, which in turn are nested within still larger waves. In mathematics it’s called a fractal structure, where at every scale the pattern is similar to the others.
Learning and other resources. Elliott Wave analysis provides context, not prophecy. As the 20th century semanticist Alfred Korzybski put it in his book Science and Sanity (1933), “The map is not the territory … The only usefulness of a map depends on similarity of structure between the empirical world and the map.” And I would add, in the ever-changing markets, we can judge that similarity of structure only after the fact.
See the menu page Analytical Methods for a rundown on where to go for information on Elliott Wave analysis.
By Tim Bovee, Portland, Oregon, June 13, 2025
Disclaimer
Tim Bovee, Private Trader tracks the analysis and trades of a private trader for his own accounts. Nothing in this blog constitutes a recommendation to buy or sell stocks, options or any other financial instrument. The only purpose of this blog is to provide education and entertainment.
No trader is ever 100 percent successful in his or her trades. Trading in the stock and option markets is risky and uncertain. Each trader must make trading decisions for his or her own account, and take responsibility for the consequences.
All content on Tim Bovee, Private Trader by Timothy K. Bovee is licensed under a Creative Commons Attribution-ShareAlike 4.0 International License.
Based on a work at www.timbovee.com.

You must be logged in to post a comment.