3:30 p.m. New York time.
Half an hour before the closing bell. The S&P 500 futures dropped slightly after the session high, 6109, reaching into the 6080s.
Elliott Wave Theory: The rising upward correction that began on June 12, wave 4, continues, as does its parent, declining wave C.
9:35 a.m. New York time.
What’s happening now. The S&P 500 E-mini futures resumed trqding overnight from 6000 and so far has risen into the 6070s;
What does it mean? Elliott Wave Theory analysis late last week yet again appeared to have found the end of rising wave 4, only to have what appeared to be a signifiant decline, the start of falling wave 5, prove to be but another subwave within wave 4’s exuberant rise.
At this point, for clarity, I’m switching to the numbering system used on the chart, where the wave number is followed by a subscript in curly brackets show how many degrees the wave stands from Intermediate degree. All of the degrees in this analysis are of signifiantly smaller degrees than Intermediate and so are negative numbrers.
Ongoing wave 4{-13], the next-to-the-last subwave within declining wave C{-12} continues. The C wave is the final subwave within a downward correction, wave 4{-11}.
In the decades I’ve worked with Elliott Wave Theory, I’ve found that the end game of a trend is filled with ambiguity, “bottom fishing” as its called when a downward movement is nearing its end, and I suppose the present end game of an upward movement could be called “top fishing”. Or whatever the direction, we can call it a ‘head fake”.
Whatever the nomenclature, wave 4{-13}, having begun on June 12, is tracing out its 3rd and likely final subwave, wave C{-14}.
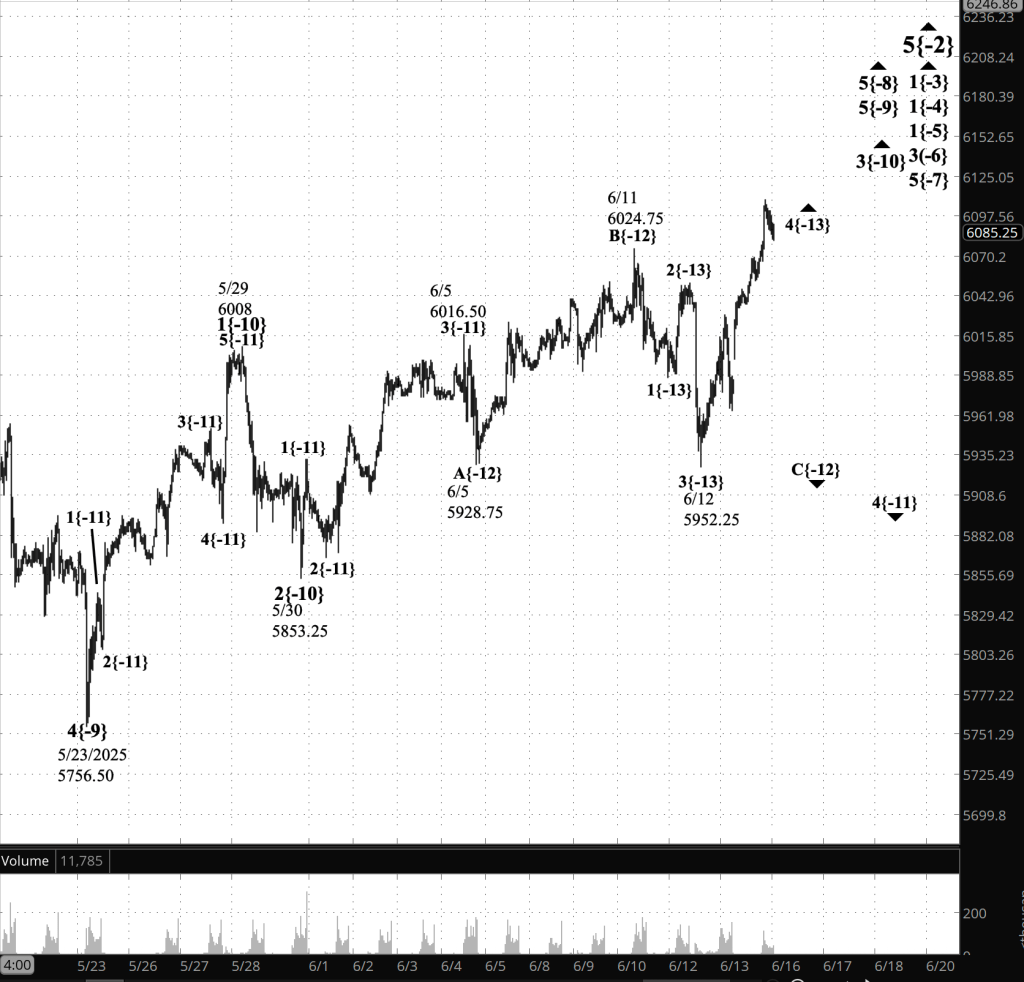
[S&P 500 E-mini futures at 3:30 p.m., 40-minute bars, with volume]
Elliott Wave Theory wave labels. Each wave listed on the charts has two components: A wave number, and a subscript in curly brackets that place the wave’s position in the fractal strucutre in relationship to Intermediate degree. The present Intermediate degree, wave 5{0}, began its rise on February 11, 2016 from 1810.10 and is still underway.
The waves referred to on the chart are as follows.
Principal analysis: Upward correction wave 5{-2} is underway and within it is working through a nested series of initial subwaves, wave 1{-3} down to wave 1{-5}. One degree lower, rising wave 3{-6} is underway and is in its final subwave, wave 5{-7},
Within wave 5{-7}, uptrending wave 5{-8} is in its final stage, uptrending wave 5{-9}.
Within wave 5{-9}, its middle subwave, wave 3{-10}, is underway. Internally, wave 3{-10} is in its next to the last subwave, wave 4{-11}, a downward correction that began from 6016.50.
Falling wave 4{-11} is in its final subwave, declining wave C{-12}, which is in its next-to-the-last subwave, rising wave 4{-13}.
Waves Now Underway
These are the waves currently in progress under my principal analysis. Each line on the list shows the wave number, with the subscript in curly brackets, the traditional degree name, the starting date, the starting price of the S&P 500 E-mini futures, and the direction of the wave.
- S&P 500 Index:
- 5{+3} Supercycle, 7/8/1932, 4.40 (up)
- 5{+2} Cycle, 12/9/1974, 60.96 (up)
- 5{+1} Primary, 3/6/2009, 666.79 (up)
- 5{0} Intermediate, 2/11/2016, 1810.10 (up)
- 3{-1} Minor, 3/23/2020, 2191.36 (up)
- 5{-2} Minute, 4/7/2025, 4832 (up)
- S&P 500 Futures
- 1{-3} Minuette, 4/7/2025, 4832 (up)
- 1{-4} Subminuette, 4/7/2025, 4832 (up)
- 1{-5} Micro, 4/7/2025, 4832 (up)
- 3{-6} Submicro, 4/21/2025, 4832 (up)
Reading the chart. Price movements — waves – – in Elliott Wave Theory analysis are labeled with numbers within trending waves and letters with corrective waves. The subscripts — numbers in curly brackets — designate the wave’s degree, which, in Elliott Wave analysis, means the relative position of a wave within the larger and smaller structures that make up the chart. R.N. Elliott, who in the 1930s developed the form of analysis that bears his name, viewed the chart as a complex structure of smaller waves nested within larger waves, which in turn are nested within still larger waves. In mathematics it’s called a fractal structure, where at every scale the pattern is similar to the others.
Learning and other resources. Elliott Wave analysis provides context, not prophecy. As the 20th century semanticist Alfred Korzybski put it in his book Science and Sanity (1933), “The map is not the territory … The only usefulness of a map depends on similarity of structure between the empirical world and the map.” And I would add, in the ever-changing markets, we can judge that similarity of structure only after the fact.
See the menu page Analytical Methods for a rundown on where to go for information on Elliott Wave analysis.
By Tim Bovee, Portland, Oregon, June 16, 2025
Disclaimer
Tim Bovee, Private Trader tracks the analysis and trades of a private trader for his own accounts. Nothing in this blog constitutes a recommendation to buy or sell stocks, options or any other financial instrument. The only purpose of this blog is to provide education and entertainment.
No trader is ever 100 percent successful in his or her trades. Trading in the stock and option markets is risky and uncertain. Each trader must make trading decisions for his or her own account, and take responsibility for the consequences.
All content on Tim Bovee, Private Trader by Timothy K. Bovee is licensed under a Creative Commons Attribution-ShareAlike 4.0 International License.
Based on a work at www.timbovee.com.

You must be logged in to post a comment.