Market holiday. Thursday, June 19, is Juneteenth, a market holiday in the United States. Markets will be closed, and I won’t be uploading analyses until markets resume trading on Friday.
3:30 p.m. New York time
Half an hour before the closing bell. The S&P 500 futures rose rapidly when the Federal Open Market Committee said it would hold interest rates steady. The price fell back, and then rose again as Fed Chair Powell held his news conference.
Elliott Wave Theory:The 4th wave downward correction that began on June 6 continues.
9:35 a.m. New York time.
What’s happening now. The S&P 500 E-mini futures rose from 6017.75 to 6072 overnight and then drew back to the 6030s as the opening bell approached.
What does it mean? Seen through the lens of Elliott Wave Theory analysis, the 4th-wave decline that began on June 16 continues. This smaller 4th wave is a subwave of a larger rising 4th wave that began on June 12, and both are part of the final subwave, declining wave C, that began on June 11..
Encompassing the whole structure is a still larger 4th wave, which began its decline on June 5.
And that’s what June has been in the S&P 500 — a tangle of 4th waves within a rising 5th wave that began on May 23 and, several degrees larger, within a rising 5th wave that began on April 7 from 4837.
The all-time high for the S&P 500 was the end of a rising 3rd wave — wave 3{-2} on the charts — on February 19, at 6166.50.
And that’s what 2025 has been like so far. Despite all of the Sturm un Drang of our society and our politics, it has been a very hopeful, bullish year on the markets.
And turning back to the small 4th wave decline now underway? (Wave 4{-14} on the chart.) It will be followed by a rising 5th wave that, as is the nature of things, will eclipse February’s all-time high with an even higher all-time high. And so it goes.
Robert Prechter, who brought about a rebirth of Elliott Wave Theory in the 20th century, sees the dance of the waves as a reflection of the public mood. Looking at the waves this year, I’d have to say that the public mood is good.
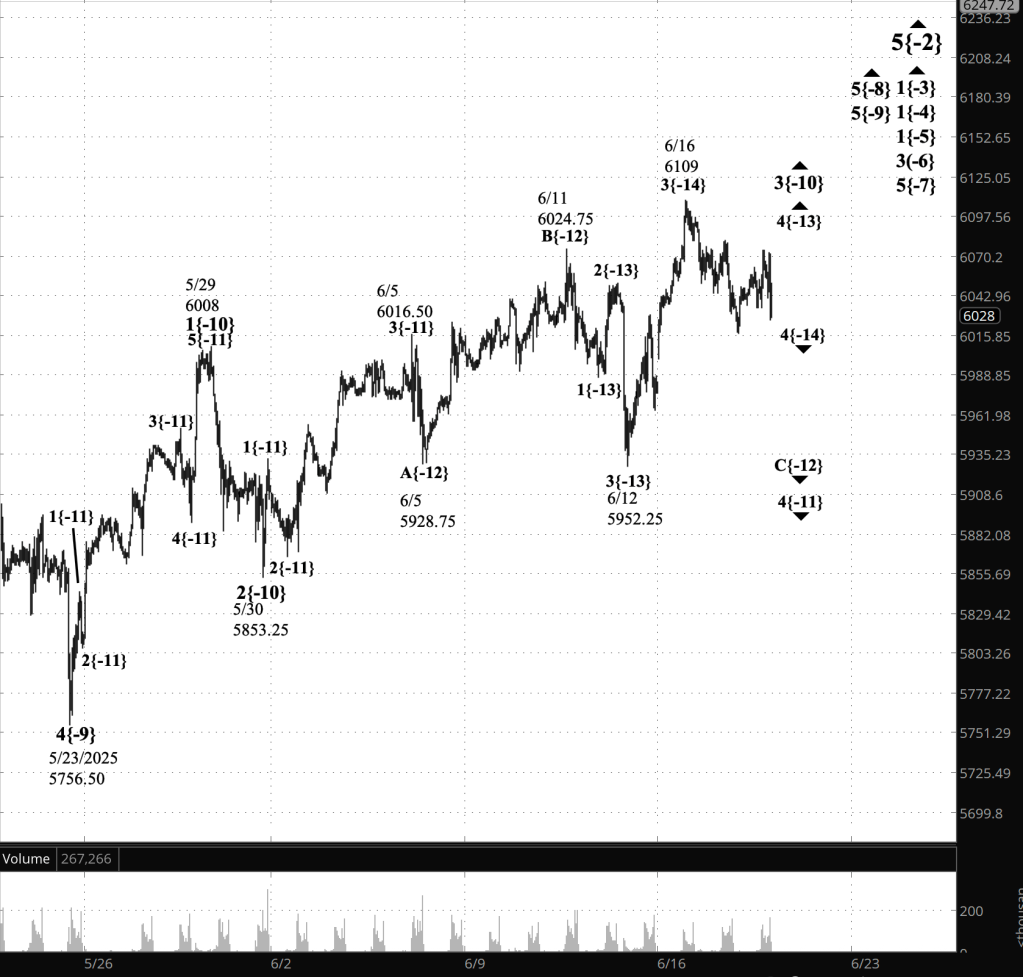
[S&P 500 E-mini futures at 3:30 p.m., 45-minute bars, with volume]
Elliott Wave Theory wave labels. Each wave listed on the charts has two components: A wave number, and a subscript in curly brackets that place the wave’s position in the fractal strucutre in relationship to Intermediate degree. The present Intermediate degree, wave 5{0}, began its rise on February 11, 2016 from 1810.10 and is still underway.
The waves referred to on the chart are as follows.
Principal analysis: Upward correction wave 5{-2} is underway and within it is working through a nested series of initial subwaves, wave 1{-3} down to wave 1{-5}. One degree lower, rising wave 3{-6} is underway and is in its final subwave, wave 5{-7},
Within wave 5{-7}, uptrending wave 5{-8} is in its final stage, uptrending wave 5{-9}.
Within wave 5{-9}, its middle subwave, wave 3{-10}, is underway. Internally, wave 3{-10} is in its next to the last subwave, wave 4{-11}, a downward correction that began from 6016.50.
Falling wave 4{-11} is in its final subwave, declining wave C{-12}, which is in its next-to-the-last subwave, rising wave 4{-13}.and which is in its final subwave
Waves Now Underway
These are the waves currently in progress under my principal analysis. Each line on the list shows the wave number, with the subscript in curly brackets, the traditional degree name, the starting date, the starting price of the S&P 500 E-mini futures, and the direction of the wave.
- S&P 500 Index:
- 5{+3} Supercycle, 7/8/1932, 4.40 (up)
- 5{+2} Cycle, 12/9/1974, 60.96 (up)
- 5{+1} Primary, 3/6/2009, 666.79 (up)
- 5{0} Intermediate, 2/11/2016, 1810.10 (up)
- 3{-1} Minor, 3/23/2020, 2191.36 (up)
- 5{-2} Minute, 4/7/2025, 4832 (up)
- S&P 500 Futures
- 1{-3} Minuette, 4/7/2025, 4832 (up)
- 1{-4} Subminuette, 4/7/2025, 4832 (up)
- 1{-5} Micro, 4/7/2025, 4832 (up)
- 3{-6} Submicro, 4/21/2025, 4832 (up)
Reading the chart. Price movements — waves – – in Elliott Wave Theory analysis are labeled with numbers within trending waves and letters with corrective waves. The subscripts — numbers in curly brackets — designate the wave’s degree, which, in Elliott Wave analysis, means the relative position of a wave within the larger and smaller structures that make up the chart. R.N. Elliott, who in the 1930s developed the form of analysis that bears his name, viewed the chart as a complex structure of smaller waves nested within larger waves, which in turn are nested within still larger waves. In mathematics it’s called a fractal structure, where at every scale the pattern is similar to the others.
Learning and other resources. Elliott Wave analysis provides context, not prophecy. As the 20th century semanticist Alfred Korzybski put it in his book Science and Sanity (1933), “The map is not the territory … The only usefulness of a map depends on similarity of structure between the empirical world and the map.” And I would add, in the ever-changing markets, we can judge that similarity of structure only after the fact.
See the menu page Analytical Methods for a rundown on where to go for information on Elliott Wave analysis.
By Tim Bovee, Portland, Oregon, June 18, 2025
Disclaimer
Tim Bovee, Private Trader tracks the analysis and trades of a private trader for his own accounts. Nothing in this blog constitutes a recommendation to buy or sell stocks, options or any other financial instrument. The only purpose of this blog is to provide education and entertainment.
No trader is ever 100 percent successful in his or her trades. Trading in the stock and option markets is risky and uncertain. Each trader must make trading decisions for his or her own account, and take responsibility for the consequences.
All content on Tim Bovee, Private Trader by Timothy K. Bovee is licensed under a Creative Commons Attribution-ShareAlike 4.0 International License.
Based on a work at www.timbovee.com.

You must be logged in to post a comment.