3:30 p.m. New York Time
Half an hour before the closing bell. The S&P 500 futures peaked at 6239 right at the opening bell, and then reversed sharply.
Elliott Wave Theory: It appears likely that today’s peak is the end of the rising 3rd wave that began on June 23 and that a 4th-wave downward correction has begun. As is often the case in Elliott wave reversals, there’s some ambiguity. In this case, the 4th wave must remain above the end of the previous 1st wave, at 6123.25 on July 23, in order to confirm that the 4th wave has indeed begun.
Based on Fibonacci retracement theory, wave 4 is likely to decline into the mid-6100s, although that’s not a certainty. If it drops below 6123.25, then the Elliott Wave Theory rule is broken and the analysis will be redone. If it ends above the 6160s, no harm, no foul — wave 5 begins, an uptrend with five subwaves.

[S&P 500 E-mini futures at 3:30 p.m., 65-minute bars, with volume]
9:35 a.m. New York time.
What’s happening now. The S&P 500 E-mini futures rose overnight, from the 6190s to a peak of 6220.75.
What does it mean? The Elliott Wave Theory wave structure has remained unchanged since the present uptrending 3rd wave began on June 23. The 3rd wave is the middle subwave of a 5th wave that began the day before, June 22. The 5th wave is the final subwave in a larger 5th wave that began its rise on May 23 from 5756.50. That’s the principal analysis.
It’s also possible, if we squint our eyes and use our imagination, to a 4th-wave downward correction within the 5th wave that began on June 22. In my view, it lacks clarity and looks more like a random scribble than a countertrend move large enough to be a 4th wave correction. None the less, clarify is far from unknown an Elliiott Wave Theory analysis, and so it’s possible that wave 3 ended on June 24, wave 4 ended on June 25, and wave 5 began on that date.
Using the labeling system on the chart, under the principal analysis we have wave 3{-11} within wave 5{-10}, and under the alternative analysis we have wave 5{-11} withi wave 5{-10}.
When wave 5{-11} is complete, it will also be the end of waves 5{-10}, 5{-9}, 5{-8}, 5{-7} and 3{-6}. The largest wave, 3{-6}, began on April 21 from 5127.25.
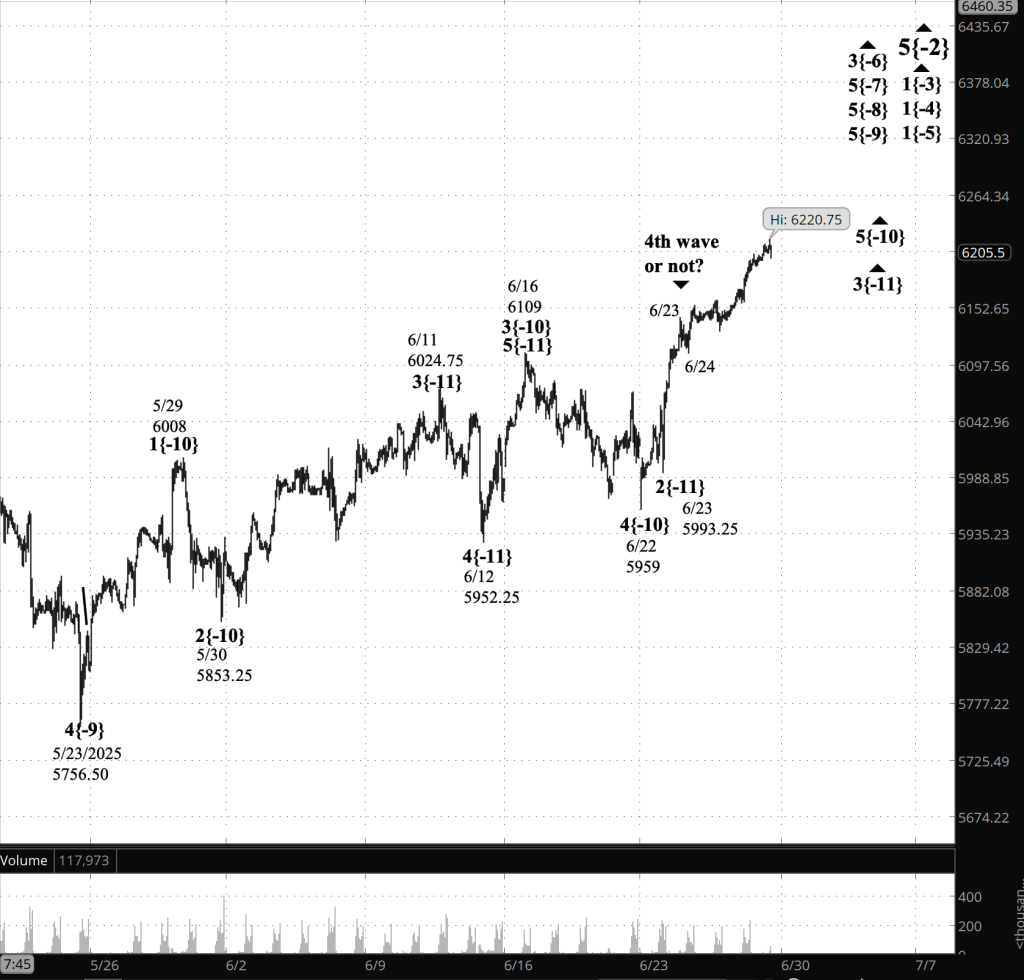
[Outdated by events: S&P 500 E-mini futures at 9:35 a.m., 65-minute bars, with volume]
Waves Now Underway
These are the waves currently in progress under my principal analysis. Each line on the list shows the wave number, with the subscript in curly brackets, the traditional degree name, the starting date, the starting price of the S&P 500 E-mini futures, and the direction of the wave.
- S&P 500 Index:
- 5{+3} Supercycle, 7/8/1932, 4.40 (up)
- 5{+2} Cycle, 12/9/1974, 60.96 (up)
- 5{+1} Primary, 3/6/2009, 666.79 (up)
- 5{0} Intermediate, 2/11/2016, 1810.10 (up)
- 3{-1} Minor, 3/23/2020, 2191.36 (up)
- 5{-2} Minute, 4/7/2025, 4832 (up)
- S&P 500 Futures
- 1{-3} Minuette, 4/7/2025, 4832 (up)
- 1{-4} Subminuette, 4/7/2025, 4832 (up)
- 1{-5} Micro, 4/7/2025, 4832 (up)
- 3{-6} Submicro, 4/24/2025, 5260 (up)
- 5{-7} Minuscule, 4/25/2025, 5550 (up)
- 5{-8} (unnamed), 5/7/2025, 5596 (up)
- 5{-9} (unnamed), 5/23/2025, 5756.50 (up)
- 5{-10} (unnamed), 6/22/2025, 5959 (up)
- 4{-11} (unnamed), 6/272025, 6239 {down}
- A{-12} (unnamed), 6/272025, 6239 {down}
Reading the chart. Price movements — waves – – in Elliott Wave Theory analysis are labeled with numbers within trending waves and letters with corrective waves. The subscripts — numbers in curly brackets — designate the wave’s degree, which, in Elliott Wave analysis, means the relative position of a wave within the larger and smaller structures that make up the chart. R.N. Elliott, who in the 1930s developed the form of analysis that bears his name, viewed the chart as a complex structure of smaller waves nested within larger waves, which in turn are nested within still larger waves. In mathematics it’s called a fractal structure, where at every scale the pattern is similar to the others.
Learning and other resources. Elliott Wave analysis provides context, not prophecy. As the 20th century semanticist Alfred Korzybski put it in his book Science and Sanity (1933), “The map is not the territory … The only usefulness of a map depends on similarity of structure between the empirical world and the map.” And I would add, in the ever-changing markets, we can judge that similarity of structure only after the fact.
See the menu page Analytical Methods for a rundown on where to go for information on Elliott Wave analysis.
By Tim Bovee, Portland, Oregon, June 27, 2025
Disclaimer
Tim Bovee, Private Trader tracks the analysis and trades of a private trader for his own accounts. Nothing in this blog constitutes a recommendation to buy or sell stocks, options or any other financial instrument. The only purpose of this blog is to provide education and entertainment.
No trader is ever 100 percent successful in his or her trades. Trading in the stock and option markets is risky and uncertain. Each trader must make trading decisions for his or her own account, and take responsibility for the consequences.
All content on Tim Bovee, Private Trader by Timothy K. Bovee is licensed under a Creative Commons Attribution-ShareAlike 4.0 International License.
Based on a work at www.timbovee.com.

You must be logged in to post a comment.