3:30 p.m. New York time
Half an hour before the closing bell. The S&P 500 futures traded in a widening whipsaw pattern during the session, swinging between the 6280s and the 6260s.
Elliott Wave Theory: The movement did nothing to clarify the ambiguities of the chart, described below in this morning’s analysis.
9:35 a.m. New York time.
What’s happening now. The S&P 500 E-mini futures worked their way higher overnight, from 6254.50 to 6289 and then leveled out in a sideways pattern.
What does it mean? The Elliott Wave Theory analysis depends upon how we interpret the July 7 low, 6246.25. We know that a 2nd-wave downward correction has been uderway since July 3. We know that subwaves falling wave A and rising wave B are complete. We know that the July 7 low has been followed by a fairly lackluster rise.
Here’s the question: Is that rise a continuation of falling wave C, or did wave C end at yesterday’s low, and therefore is the rise that followed the early steps in rising wave 3?
Or, yet another alternative, are the waves labeled A, B and C on the chart the subwaves within wave A, which under this scenario ended on July 7, and therefore is wave B in its beginning stages?
The beauty of Elliiott Wave Theory is that ambiguities are eventually resolved. Eventually, not always immediately.
Meanwhile, consistent with my “show me” approach, I’ve kept the first scenario — wave C underway — as my principal analysis, and am keeping close watch to see whether on of the alternative analyses should in fact be labeled as primary.
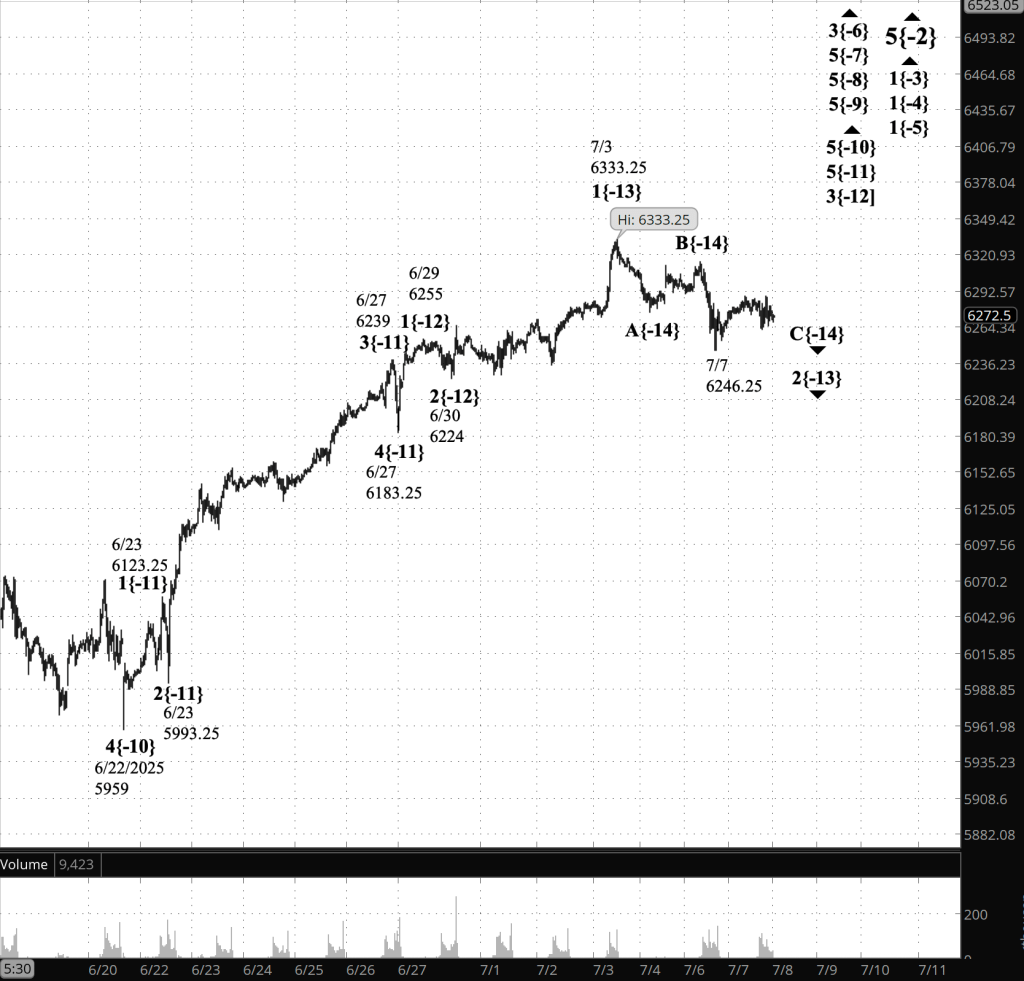
[S&P 500 E-mini futures at 3:30 p.m., 30-minute bars, with volume]
Waves Now Underway
These are the waves currently in progress under my principal analysis. Each line on the list shows the wave number, with the subscript in curly brackets, the traditional degree name, the starting date, the starting price of the S&P 500 E-mini futures, and the direction of the wave.
- S&P 500 Index:
- 5{+3} Supercycle, 7/8/1932, 4.40 (up)
- 5{+2} Cycle, 12/9/1974, 60.96 (up)
- 5{+1} Primary, 3/6/2009, 666.79 (up)
- 5{0} Intermediate, 2/11/2016, 1810.10 (up)
- 3{-1} Minor, 3/23/2020, 2191.36 (up)
- 5{-2} Minute, 4/7/2025, 4832 (up)
- S&P 500 Futures
- 1{-3} Minuette, 4/7/2025, 4832 (up)
- 1{-4} Subminuette, 4/7/2025, 4832 (up)
- 1{-5} Micro, 4/7/2025, 4832 (up)
- 3{-6} Submicro, 4/24/2025, 5260 (up)
- 5{-7} Minuscule, 4/25/2025, 5550 (up)
- 5{-8} (unnamed), 5/7/2025, 5596 (up)
- 5{-9} (unnamed), 5/23/2025, 5756.50 (up)
- 5{-10} (unnamed), 6/22/2025, 5959 (up)
- 5{-11} (unnamed), 6/27/2025, 6183.25 (up)
- 3{-12} (unnamed), 6/30/2025, 6224 (up)
- 2{-13} (unnamed), 7/3/2025, 6335.25 (down)
- C{-14} (unnamed), 7/4/2025, 6276.50 (down)
Reading the chart. Price movements — waves – – in Elliott Wave Theory analysis are labeled with numbers within trending waves and letters with corrective waves. The subscripts — numbers in curly brackets — designate the wave’s degree, which, in Elliott Wave analysis, means the relative position of a wave within the larger and smaller structures that make up the chart. R.N. Elliott, who in the 1930s developed the form of analysis that bears his name, viewed the chart as a complex structure of smaller waves nested within larger waves, which in turn are nested within still larger waves. In mathematics it’s called a fractal structure, where at every scale the pattern is similar to the others.
Learning and other resources. Elliott Wave analysis provides context, not prophecy. As the 20th century semanticist Alfred Korzybski put it in his book Science and Sanity (1933), “The map is not the territory … The only usefulness of a map depends on similarity of structure between the empirical world and the map.” And I would add, in the ever-changing markets, we can judge that similarity of structure only after the fact.
See the menu page Analytical Methods for a rundown on where to go for information on Elliott Wave analysis.
By Tim Bovee, Portland, Oregon, July 8, 2025
Disclaimer
Tim Bovee, Private Trader tracks the analysis and trades of a private trader for his own accounts. Nothing in this blog constitutes a recommendation to buy or sell stocks, options or any other financial instrument. The only purpose of this blog is to provide education and entertainment.
No trader is ever 100 percent successful in his or her trades. Trading in the stock and option markets is risky and uncertain. Each trader must make trading decisions for his or her own account, and take responsibility for the consequences.
All content on Tim Bovee, Private Trader by Timothy K. Bovee is licensed under a Creative Commons Attribution-ShareAlike 4.0 International License.
Based on a work at www.timbovee.com.

You must be logged in to post a comment.