3:30 p.m. New York time
Half an hour before the opening bell. The S&P 500 futures continued their during the session, reaching the price, 6333.25. It was as though it had hit a wall. The price reversed, fell back into the 6270s, and then began to rise again.
Elliott Wave Theory: So what makes 6333.25 special? That price is the precise ending point for wave B within the 2nd-wave downward correction that began on July 3.
Elliott Wave Theory is based on the idea that the price movements represent the opinions and feelings of traders. There are a sufficiently large number of traders in S&P 500-related products that in my opinion it would be close to accurate to the feelings and opinions of Americans.
Traders figuratively said “No more” on July 7 when wave B ended, and did it again today, showing that that traders were still uneasy, That upper limit still has power.
For the analysis, it means there is not yet confirmation regarding the end of wave C. It could have ended on July 7, as the alternate analysis says. If so, the session rise was part of the wave 1 within uptrending wave 5. A 1st wave often tends to pause or bounce back when it reaches the wave of the preceding correction’s wave B. Or it could be wave C correcting its continuing decline.
The chart immediately below tracks five days of the S&P 500 futures with 5-minute bars.
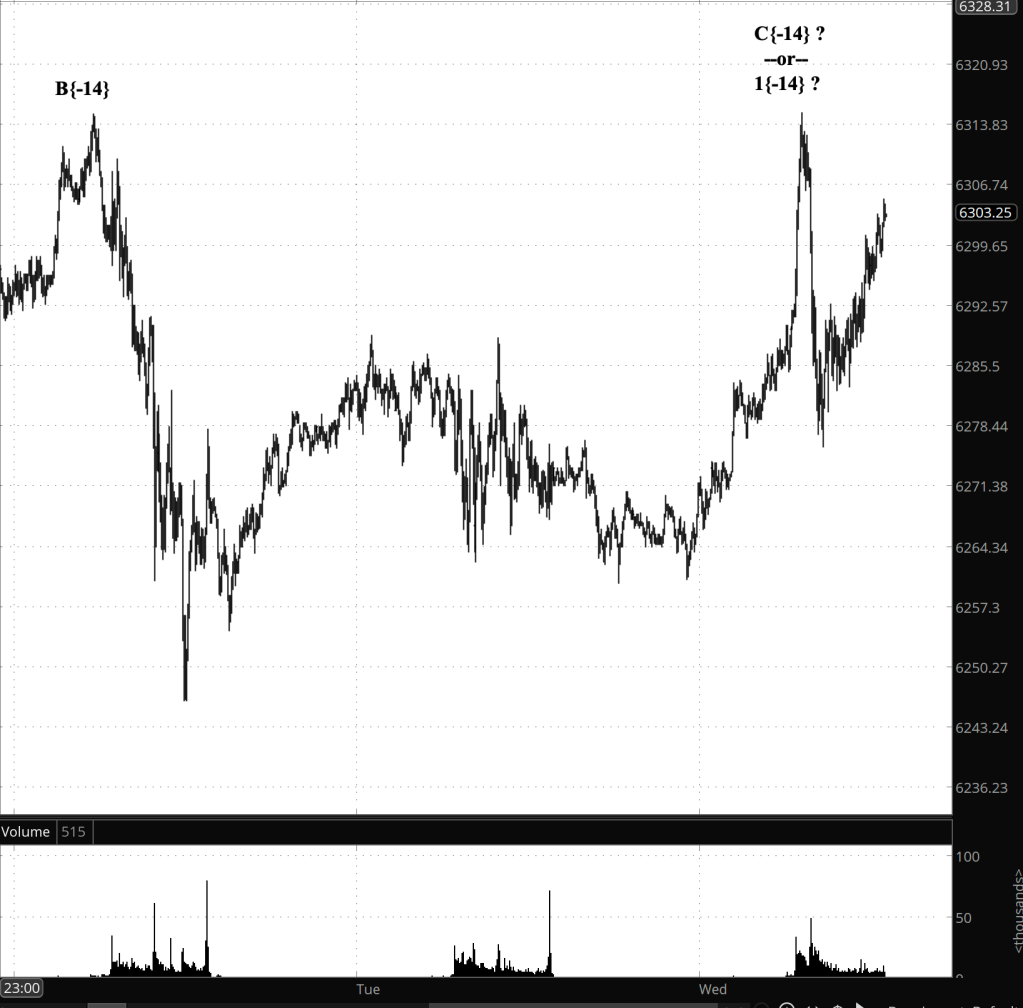
[S&P 500 E-mini futures at 3:30 p.m., 30-minute bars, with volume]
9:35 a.m. New York time.
What’s happening now. The S&P 500 E-mini futures rose overnight in what appears to be another leg in a net sideways pattern that began on July 7.
What does it mean? Elliott Wave Theory analysis gives us two possible wave structures that are underway since the beginning of the 2nd-wave downward correction that began on July 3.
The current principal analysis is that the first two subwaves within the correction — waves A and B — are complete, and declining wave C is underway
The alternative analysis sees wave C as having ended at the July 7 low, 6246.25. Under this scenario, the 2nd wave also ended ended at that, and wave 3 began.
My strategy in choosing between the two is to wait for a breakout. I will retain the C{-14} scenario unless the price closes convincingly above 6315–6317 — above the end of wave B — at which point I will recognize that C has ended and a new upward sequence, wave 1 within uptrending wave 3, has begun.
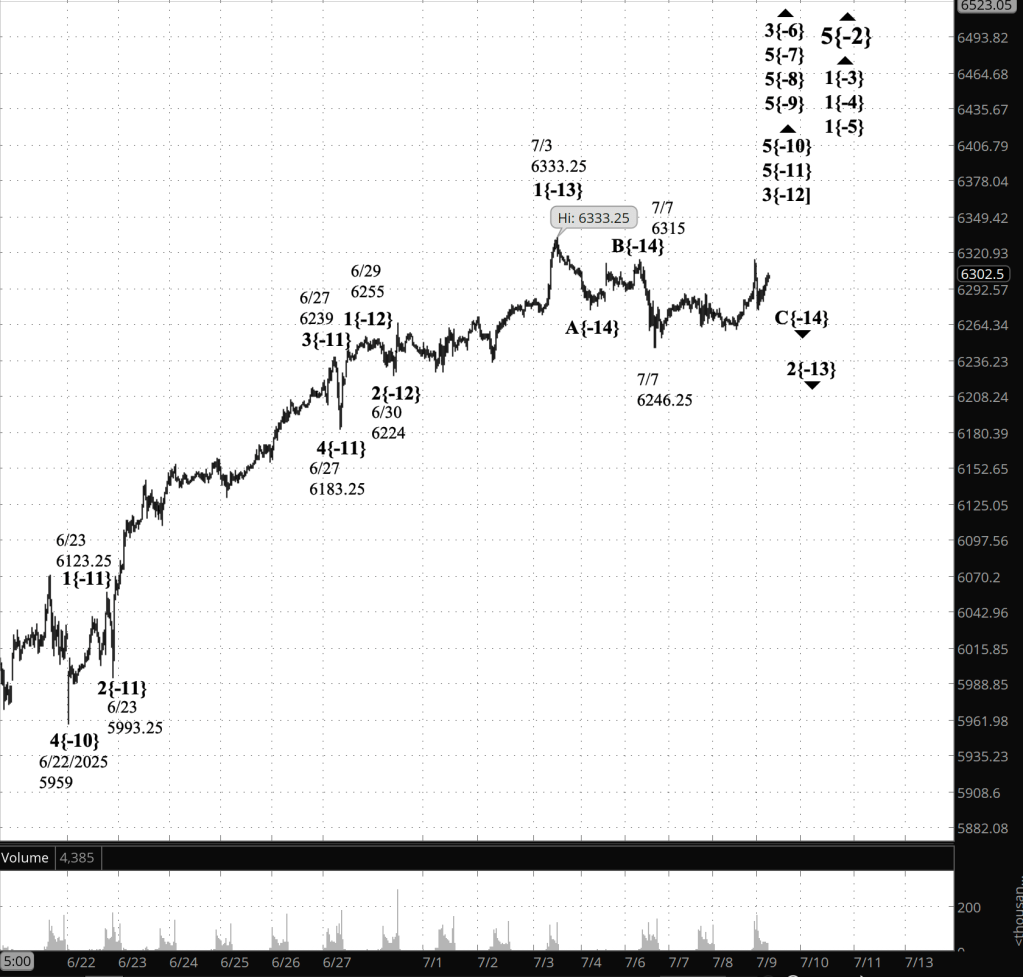
[S&P 500 E-mini futures at 3:30 p.m., 30-minute bars, with volume]
Waves Now Underway
These are the waves currently in progress under my principal analysis. Each line on the list shows the wave number, with the subscript in curly brackets, the traditional degree name, the starting date, the starting price of the S&P 500 E-mini futures, and the direction of the wave.
- S&P 500 Index:
- 5{+3} Supercycle, 7/8/1932, 4.40 (up)
- 5{+2} Cycle, 12/9/1974, 60.96 (up)
- 5{+1} Primary, 3/6/2009, 666.79 (up)
- 5{0} Intermediate, 2/11/2016, 1810.10 (up)
- 3{-1} Minor, 3/23/2020, 2191.36 (up)
- 5{-2} Minute, 4/7/2025, 4832 (up)
- S&P 500 Futures
- 1{-3} Minuette, 4/7/2025, 4832 (up)
- 1{-4} Subminuette, 4/7/2025, 4832 (up)
- 1{-5} Micro, 4/7/2025, 4832 (up)
- 3{-6} Submicro, 4/24/2025, 5260 (up)
- 5{-7} Minuscule, 4/25/2025, 5550 (up)
- 5{-8} (unnamed), 5/7/2025, 5596 (up)
- 5{-9} (unnamed), 5/23/2025, 5756.50 (up)
- 5{-10} (unnamed), 6/22/2025, 5959 (up)
- 5{-11} (unnamed), 6/27/2025, 6183.25 (up)
- 3{-12} (unnamed), 6/30/2025, 6224 (up)
- 2{-13} (unnamed), 7/3/2025, 6335.25 (down)
- C{-14} (unnamed), 7/4/2025, 6276.50 (down)
Reading the chart. Price movements — waves – – in Elliott Wave Theory analysis are labeled with numbers within trending waves and letters with corrective waves. The subscripts — numbers in curly brackets — designate the wave’s degree, which, in Elliott Wave analysis, means the relative position of a wave within the larger and smaller structures that make up the chart. R.N. Elliott, who in the 1930s developed the form of analysis that bears his name, viewed the chart as a complex structure of smaller waves nested within larger waves, which in turn are nested within still larger waves. In mathematics it’s called a fractal structure, where at every scale the pattern is similar to the others.
Learning and other resources. Elliott Wave analysis provides context, not prophecy. As the 20th century semanticist Alfred Korzybski put it in his book Science and Sanity (1933), “The map is not the territory … The only usefulness of a map depends on similarity of structure between the empirical world and the map.” And I would add, in the ever-changing markets, we can judge that similarity of structure only after the fact.
See the menu page Analytical Methods for a rundown on where to go for information on Elliott Wave analysis.
By Tim Bovee, Portland, Oregon, July 9, 2025
Disclaimer
Tim Bovee, Private Trader tracks the analysis and trades of a private trader for his own accounts. Nothing in this blog constitutes a recommendation to buy or sell stocks, options or any other financial instrument. The only purpose of this blog is to provide education and entertainment.
No trader is ever 100 percent successful in his or her trades. Trading in the stock and option markets is risky and uncertain. Each trader must make trading decisions for his or her own account, and take responsibility for the consequences.
All content on Tim Bovee, Private Trader by Timothy K. Bovee is licensed under a Creative Commons Attribution-ShareAlike 4.0 International License.
Based on a work at www.timbovee.com.

You must be logged in to post a comment.