3:30 p.m. New York time.
Half an hour before the closing bell. The S&P 500 futures verified that it has completed the correction and is trending upward.
Elliott Wave Theory: The verification of Wave 2’s end came early in the session as the price for what had appeared to be wave C, the third subwave of the correction, rose higher than wave B and continued to move higher.
That resolved the ambiguities we’ve been seeing over the last few days. For this discussion I’ll use the labeling system on the chart: A wave number followed by a subscript in curly brackets with the wave’s distance in the fractal structure from the Intermediate degree.
The new principal analysis: Wave C{-14} ended on July 7 and in doing so also brought wave 2{-13} to an end, at 6246.25. From that point wave 3{-13} began and is in its middle subwave, wave 3{-14}. All of tis is contained with the parent wave 3{-12} and grandparent wave 5{-11}, which began June 27.
Bottom line: The collection of 3rd waves provide ample ground for a period of upward lean, with the usually downward corrections long the way.
9:35 a.m. New York time.
What’s happening now. The S&P 500 E-mini futures fell from 6312.25 to 6287.50 and then bounced almost all the way back.
What does it mean? Elliott Wave Theory analysis sees the pattern as a failed attempt to break above the end of the preceding B wave, a subwave of the 2nd wave downward correction that began July 3. ES keeps failling to move above the peak of wave B. Is the wave testing that upper limit wave C or did wave C end on July 7, making the wave doing the testing a subwave of uptrending wave 3? Increasingly, it appears to be an early subwave within wave 3. But wthout a breakout there is no verification. So I’m keeping the wave C within wave 2 scenario as my principal analysis.
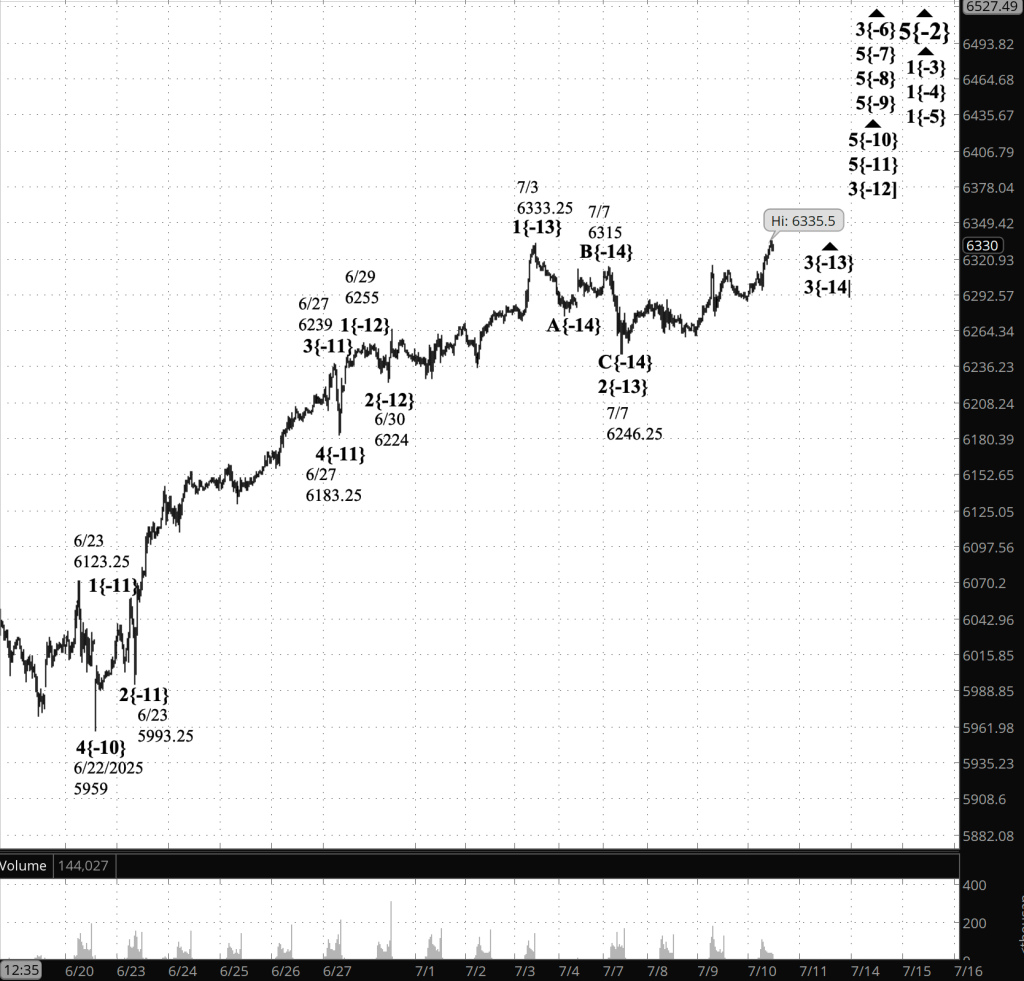
[S&P 500 E-mini futures at 3:30 p.m., 35-minute bars, with volume]
Waves Now Underway
These are the waves currently in progress under my principal analysis. Each line on the list shows the wave number, with the subscript in curly brackets, the traditional degree name, the starting date, the starting price of the S&P 500 E-mini futures, and the direction of the wave.
- S&P 500 Index:
- 5{+3} Supercycle, 7/8/1932, 4.40 (up)
- 5{+2} Cycle, 12/9/1974, 60.96 (up)
- 5{+1} Primary, 3/6/2009, 666.79 (up)
- 5{0} Intermediate, 2/11/2016, 1810.10 (up)
- 3{-1} Minor, 3/23/2020, 2191.36 (up)
- 5{-2} Minute, 4/7/2025, 4832 (up)
- S&P 500 Futures
- 1{-3} Minuette, 4/7/2025, 4832 (up)
- 1{-4} Subminuette, 4/7/2025, 4832 (up)
- 1{-5} Micro, 4/7/2025, 4832 (up)
- 3{-6} Submicro, 4/24/2025, 5260 (up)
- 5{-7} Minuscule, 4/25/2025, 5550 (up)
- 5{-8} (unnamed), 5/7/2025, 5596 (up)
- 5{-9} (unnamed), 5/23/2025, 5756.50 (up)
- 5{-10} (unnamed), 6/22/2025, 5959 (up)
- 5{-11} (unnamed), 6/27/2025, 6183.25 (up)
- 3{-12} (unnamed), 6/30/2025, 6224 (up)
- 3{-13} (unnamed), 7/7/2025, 6246.25 (up)
- 3{-14} (unnamed), 7/4/2025, 6260 (up)
Reading the chart. Price movements — waves – – in Elliott Wave Theory analysis are labeled with numbers within trending waves and letters with corrective waves. The subscripts — numbers in curly brackets — designate the wave’s degree, which, in Elliott Wave analysis, means the relative position of a wave within the larger and smaller structures that make up the chart. R.N. Elliott, who in the 1930s developed the form of analysis that bears his name, viewed the chart as a complex structure of smaller waves nested within larger waves, which in turn are nested within still larger waves. In mathematics it’s called a fractal structure, where at every scale the pattern is similar to the others.
Learning and other resources. Elliott Wave analysis provides context, not prophecy. As the 20th century semanticist Alfred Korzybski put it in his book Science and Sanity (1933), “The map is not the territory … The only usefulness of a map depends on similarity of structure between the empirical world and the map.” And I would add, in the ever-changing markets, we can judge that similarity of structure only after the fact.
See the menu page Analytical Methods for a rundown on where to go for information on Elliott Wave analysis.
By Tim Bovee, Portland, Oregon, July 10, 2025
Disclaimer
Tim Bovee, Private Trader tracks the analysis and trades of a private trader for his own accounts. Nothing in this blog constitutes a recommendation to buy or sell stocks, options or any other financial instrument. The only purpose of this blog is to provide education and entertainment.
No trader is ever 100 percent successful in his or her trades. Trading in the stock and option markets is risky and uncertain. Each trader must make trading decisions for his or her own account, and take responsibility for the consequences.
All content on Tim Bovee, Private Trader by Timothy K. Bovee is licensed under a Creative Commons Attribution-ShareAlike 4.0 International License.
Based on a work at www.timbovee.com.

You must be logged in to post a comment.