3:30 p.m. New York time
Half an hour before the closing bell. That analysis this morning? The one below on this page? Forget about it.
The S&P 500 futures turned up up during the session, rising to so far to 6315, which is above the end point of wave B by a few dollars. In a Zigzag correction, a C-wave cannot exceed wave B’s highest price, under the rules of Elliott Wave Theory.
So what’s really happening? Wave C ended today at 6259.75. At that point, the parent wave, a 4th-wave downward correction that began on July 10, also ended. Wave 5 began and is in its early waves.
Bottom line: The bearish decline has over and the bullish rise has begun.
Fifth waves have quirky souls. Sometimes they remain below the end of the preceding 4th wave, a condition called “truncation”. Sometimes they reach above the 4th wave and end at a level not dissimilar to other waves in the group. And sometimes they rise an incredible amount, a condition called “extension”.
Which type is this 5th wave? No way to know at this point. To overuse a fine old cliche, Time will tell.
9:35 a.m. New York time.
What’s happening now. The S&P 500 E-mini futures opened the week overnight with a gap to the downside of 20 points and then continued to fall, rising slightly as the opening bell approached.
What does it mean? Elliott Wave Theory analysis: Wave C, the final subwave of the 4th-wave downward correction that began on July 10, is underway.
Based on Fibonacci retracement levels, wave C at a minimum is likely to reach 6276.75 at a minimum. This would be the length of the preceding wave A.
Sometimes C waves go farther. A retracement of 1.272 times the A-wave would bring the price down to 6260.78.
And a retracement of 1.618 times the A wave would bring wave C down to 6240.44.
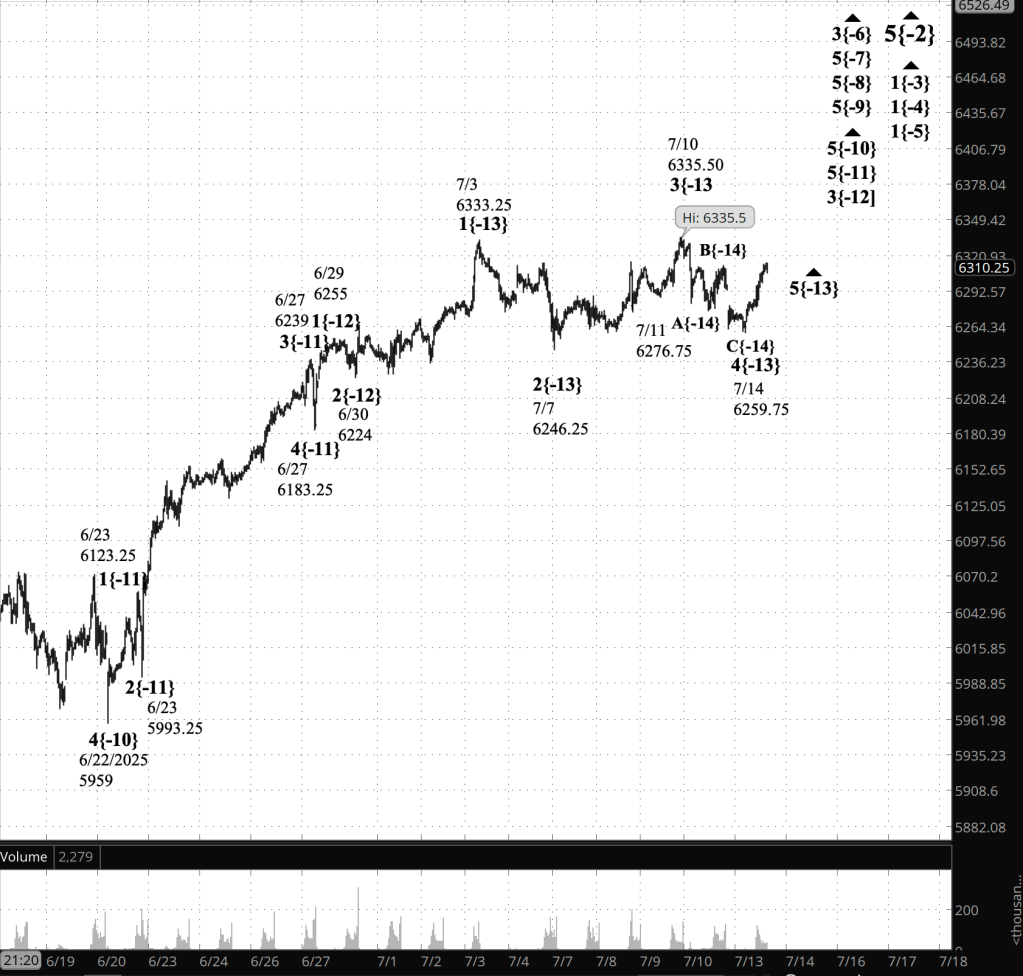
[S&P 500 E-mini futures at 3:30.m., 40-minute bars, with volume]
Waves Now Underway
[Updated for the afternoon analysis.]
These are the waves currently in progress under my principal analysis. Each line on the list shows the wave number, with the subscript in curly brackets, the traditional degree name, the starting date, the starting price of the S&P 500 E-mini futures, and the direction of the wave.
- S&P 500 Index:
- 5{+3} Supercycle, 7/8/1932, 4.40 (up)
- 5{+2} Cycle, 12/9/1974, 60.96 (up)
- 5{+1} Primary, 3/6/2009, 666.79 (up)
- 5{0} Intermediate, 2/11/2016, 1810.10 (up)
- 3{-1} Minor, 3/23/2020, 2191.36 (up)
- 5{-2} Minute, 4/7/2025, 4832 (up)
- S&P 500 Futures
- 1{-3} Minuette, 4/7/2025, 4832 (up)
- 1{-4} Subminuette, 4/7/2025, 4832 (up)
- 1{-5} Micro, 4/7/2025, 4832 (up)
- 3{-6} Submicro, 4/24/2025, 5260 (up)
- 5{-7} Minuscule, 4/25/2025, 5550 (up)
- 5{-8} (unnamed), 5/7/2025, 5596 (up)
- 5{-9} (unnamed), 5/23/2025, 5756.50 (up)
- 5{-10} (unnamed), 6/22/2025, 5959 (up)
- 5{-11} (unnamed), 6/27/2025, 6183.25 (up)
- 3{-12} (unnamed), 6/30/2025, 6224 (up)
- 5{-13} (unnamed), 7/14/2025, 6529.75 (up)
Reading the chart. Price movements — waves – – in Elliott Wave Theory analysis are labeled with numbers within trending waves and letters with corrective waves. The subscripts — numbers in curly brackets — designate the wave’s degree, which, in Elliott Wave analysis, means the relative position of a wave within the larger and smaller structures that make up the chart. R.N. Elliott, who in the 1930s developed the form of analysis that bears his name, viewed the chart as a complex structure of smaller waves nested within larger waves, which in turn are nested within still larger waves. In mathematics it’s called a fractal structure, where at every scale the pattern is similar to the others.
Learning and other resources. Elliott Wave analysis provides context, not prophecy. As the 20th century semanticist Alfred Korzybski put it in his book Science and Sanity (1933), “The map is not the territory … The only usefulness of a map depends on similarity of structure between the empirical world and the map.” And I would add, in the ever-changing markets, we can judge that similarity of structure only after the fact.
See the menu page Analytical Methods for a rundown on where to go for information on Elliott Wave analysis.
By Tim Bovee, Portland, Oregon, July 14, 2025
Disclaimer
Tim Bovee, Private Trader tracks the analysis and trades of a private trader for his own accounts. Nothing in this blog constitutes a recommendation to buy or sell stocks, options or any other financial instrument. The only purpose of this blog is to provide education and entertainment.
No trader is ever 100 percent successful in his or her trades. Trading in the stock and option markets is risky and uncertain. Each trader must make trading decisions for his or her own account, and take responsibility for the consequences.
All content on Tim Bovee, Private Trader by Timothy K. Bovee is licensed under a Creative Commons Attribution-ShareAlike 4.0 International License.
Based on a work at www.timbovee.com.

You must be logged in to post a comment.