3:30 p.m. New York time
Half an hour before the closing bell. The S&P 500 futures fell a bit lower during the session. Elliott Wave Theory: For the present I’ve retained this morning’s analysis: Wave 5 within a larger wave 5 within a still larger wave 3 is underway. The previous wave 4 has fallen sufficiently to match its location within the larger 5th wave and to show similarity in size and duration, more or less, with other waves of similar degree. If there is a sharper move deeper to the downside, then I’ll revert the analysis to 4th wave.
9:35 a.m. New York time.
What’s happening now. The S&P 500 E-mini futures rose 15 points, to 6343, in two minutes after the Consumer Price Index report for June It then settled back and resumed its course through the 6330s.
What does it mean? Elliott Wave Theory analysis, when applied to the chart, sees the 5th wave that began on July 14 as already being its 5th and final subwave. Fishing for the end of the 5th wav has always been a tricky sport. The moment I think wave 5 is over, it reverses and rises some more.
That’s where things stand now. So I’ve retained the count that sees wave 5 as still being underway. My confirmation rule of thumb is, If the price declines to the end of the preceding 4th-wave downward correction — 6300.75 — then I’ll consider wave 5 to have ended at the previous high, and with it, the parent 3rd wave.
Once that occurs, it will be the start of another, larger 4th-wave downward correction.
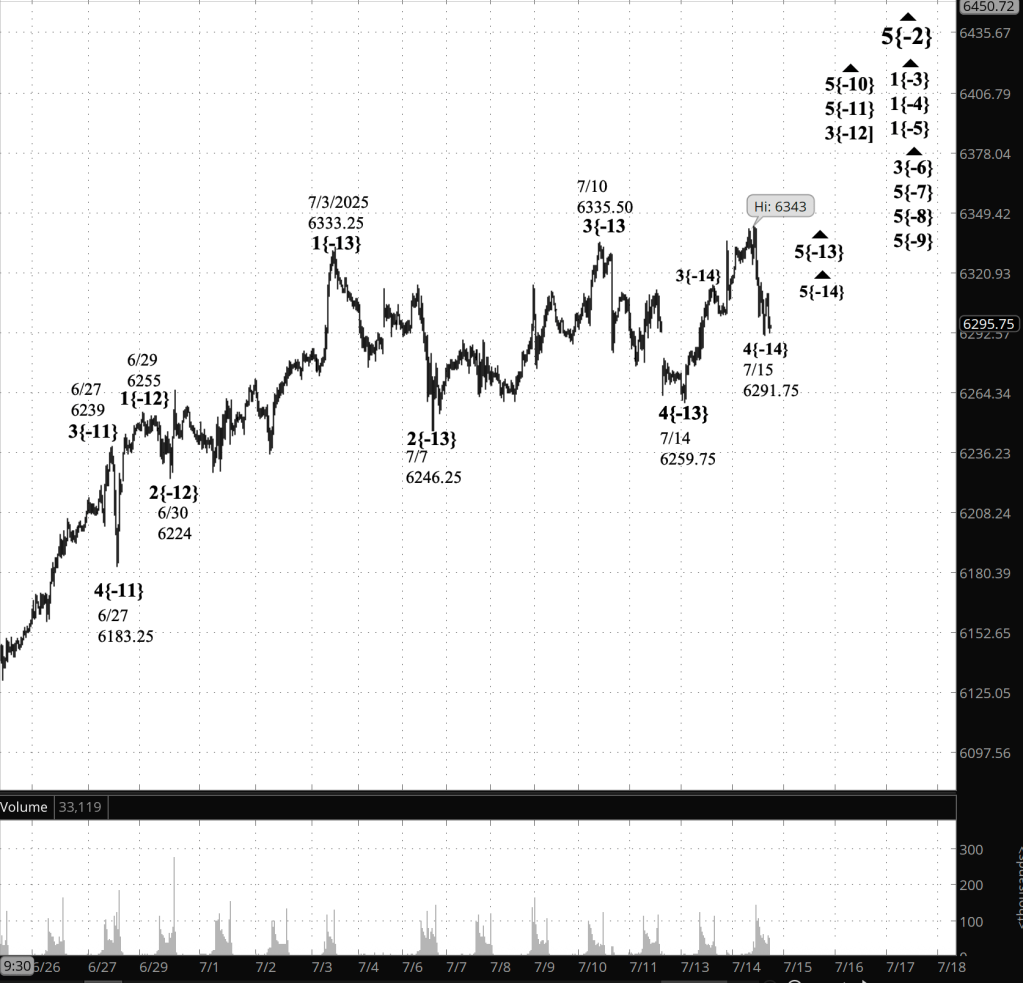
[S&P 500 E-mini futures at 3:30 p.m., 30-minute bars, with volume]
Waves Now Underway
These are the waves currently in progress under my principal analysis. Each line on the list shows the wave number, with the subscript in curly brackets, the traditional degree name, the starting date, the starting price of the S&P 500 E-mini futures, and the direction of the wave.
- S&P 500 Index:
- 5{+3} Supercycle, 7/8/1932, 4.40 (up)
- 5{+2} Cycle, 12/9/1974, 60.96 (up)
- 5{+1} Primary, 3/6/2009, 666.79 (up)
- 5{0} Intermediate, 2/11/2016, 1810.10 (up)
- 3{-1} Minor, 3/23/2020, 2191.36 (up)
- 5{-2} Minute, 4/7/2025, 4832 (up)
- S&P 500 Futures
- 1{-3} Minuette, 4/7/2025, 4832 (up)
- 1{-4} Subminuette, 4/7/2025, 4832 (up)
- 1{-5} Micro, 4/7/2025, 4832 (up)
- 3{-6} Submicro, 4/24/2025, 5260 (up)
- 5{-7} Minuscule, 4/25/2025, 5550 (up)
- 5{-8} (unnamed), 5/7/2025, 5596 (up)
- 5{-9} (unnamed), 5/23/2025, 5756.50 (up)
- 5{-10} (unnamed), 6/22/2025, 5959 (up)
- 5{-11} (unnamed), 6/27/2025, 6183.25 (up)
- 3{-12} (unnamed), 6/30/2025, 6224 (up)
- 5{-13} (unnamed), 7/14/2025, 6529.75 (up)
Reading the chart. Price movements — waves – – in Elliott Wave Theory analysis are labeled with numbers within trending waves and letters with corrective waves. The subscripts — numbers in curly brackets — designate the wave’s degree, which, in Elliott Wave analysis, means the relative position of a wave within the larger and smaller structures that make up the chart. R.N. Elliott, who in the 1930s developed the form of analysis that bears his name, viewed the chart as a complex structure of smaller waves nested within larger waves, which in turn are nested within still larger waves. In mathematics it’s called a fractal structure, where at every scale the pattern is similar to the others.
Learning and other resources. Elliott Wave analysis provides context, not prophecy. As the 20th century semanticist Alfred Korzybski put it in his book Science and Sanity (1933), “The map is not the territory … The only usefulness of a map depends on similarity of structure between the empirical world and the map.” And I would add, in the ever-changing markets, we can judge that similarity of structure only after the fact.
See the menu page Analytical Methods for a rundown on where to go for information on Elliott Wave analysis.
By Tim Bovee, Portland, Oregon, July 15, 2025
Disclaimer
Tim Bovee, Private Trader tracks the analysis and trades of a private trader for his own accounts. Nothing in this blog constitutes a recommendation to buy or sell stocks, options or any other financial instrument. The only purpose of this blog is to provide education and entertainment.
No trader is ever 100 percent successful in his or her trades. Trading in the stock and option markets is risky and uncertain. Each trader must make trading decisions for his or her own account, and take responsibility for the consequences.
All content on Tim Bovee, Private Trader by Timothy K. Bovee is licensed under a Creative Commons Attribution-ShareAlike 4.0 International License.
Based on a work at www.timbovee.com.

You must be logged in to post a comment.