3:30 p.m. New York time
Half an hour before the closing bell. The S&P 500 futures resumed its rise during the session, reaching the 6430s so far.
Elliott Wave Theory analysis: Wave 5 continues its uptrending movement within a larger 5th wave. Within the smaller 5th wave, it’s middle subwave is underway, wave 3.
9:35 a.m. New York time.
What’s happening now. The S&P 500 E-mini futures fell from 6421.25 to 6402 and then rose slightly.
What does it mean? There were three subwaves within the decline 4th-wave downward correction that began on July 23, classical corrective pattern with Elliott Wave Theory. The subsequent rise by position would be uptrending wave 5, the final subwave within a larger 5th wave that began on July 22.
However, it’s messy. The advance from 6391.50 lacks the strong, impulsive character typically expected of a 5th wave. The current movement is overlapping and sluggish, raising the possibility that wave 5{-17} could form as a diagonal or other complex structure. A drop below 6391.50 would invalidate this early 5th-wave interpretation.
Another, less likely alternative is that what is labeled as the end of wave 3 is in fact the beginning of a subwave within 3 rather than being wave 4 as the same degree as wave 3. The internals of wave 3 seems complete in their structure at the end of the principal analysis — wave 3 ended on July 23 — but the occasional ambiguities of the chart allow some room for wave 3 having ended overnight.
Bottom line: We don’t know for certain what we’re seeing, but presumably we shall know soon. A resumption of the rise would give credence to the wave 5 scenario. I declne below the 5th-wave starting point, 6391.50, would suggest that wave 5 has not yet began.
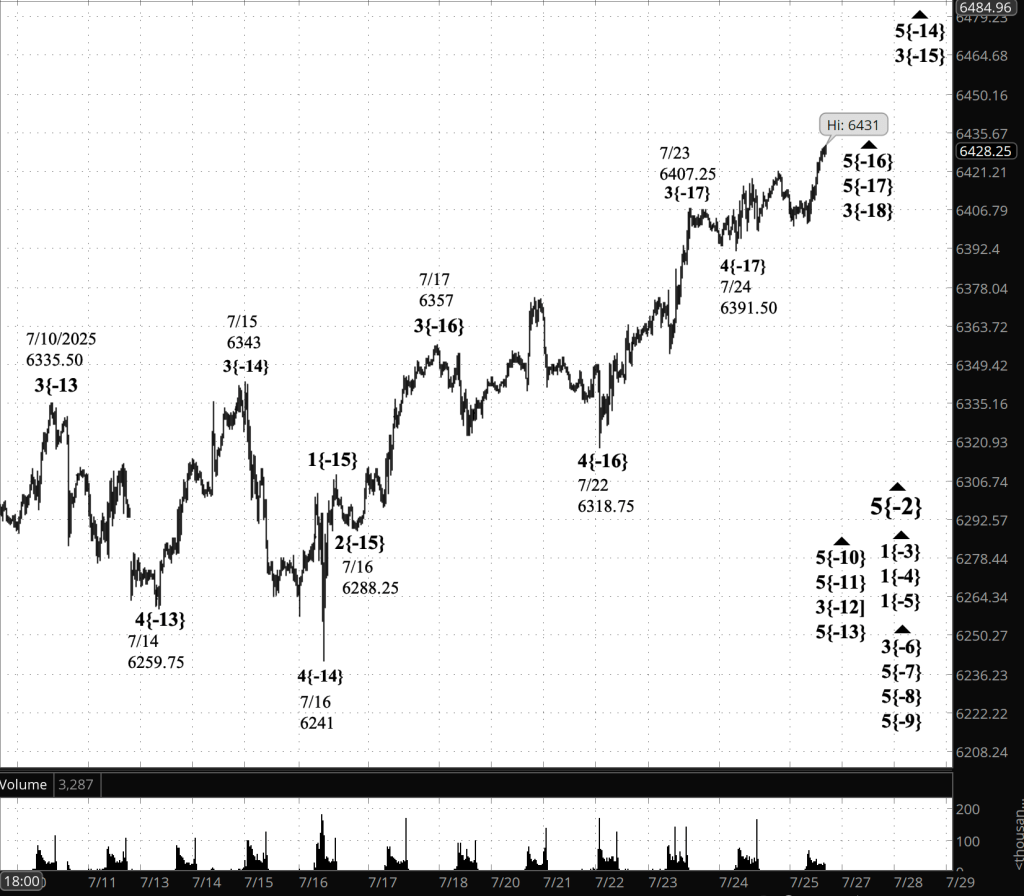
[S&P 500 E-mini futures at 3:30 p.m., 25-minute bars, with volume]
Waves Now Underway
These are the waves currently in progress under my principal analysis. Each line on the list shows the wave number, with the subscript in curly brackets, the traditional degree name, the starting date, the starting price of the S&P 500 E-mini futures, and the direction of the wave.
- S&P 500 Index:
- 5{+3} Supercycle, 7/8/1932, 4.40 (up)
- 5{+2} Cycle, 12/9/1974, 60.96 (up)
- 5{+1} Primary, 3/6/2009, 666.79 (up)
- 5{0} Intermediate, 2/11/2016, 1810.10 (up)
- 3{-1} Minor, 3/23/2020, 2191.36 (up)
- 5{-2} Minute, 4/7/2025, 4832 (up)
- S&P 500 Futures
- 1{-3} Minuette, 4/7/2025, 4832 (up)
- 1{-4} Subminuette, 4/7/2025, 4832 (up)
- 1{-5} Micro, 4/7/2025, 4832 (up)
- 3{-6} Submicro, 4/24/2025, 5260 (up)
- 5{-7} Minuscule, 4/25/2025, 5550 (up)
- 5{-8} (unnamed), 5/7/2025, 5596 (up)
- 5{-9} (unnamed), 5/23/2025, 5756.50 (up)
- 5{-10} (unnamed), 6/22/2025, 5959 (up)
- 5{-11} (unnamed), 6/27/2025, 6183.25 (up)
- 3{-12} (unnamed), 6/30/2025, 6224 (up)
- 5{-13} (unnamed), 7/14/2025, 6529.75 (up)
- 5{-14} (unnamed), 7/16/2025, 6241 (up)
- 3{-15} (unnamed), 7/16/2025, 6288.25 (up)
- 5{-16} (unnamed), 7/2/2025, 6391.50 (up)
Reading the chart. Price movements — waves – – in Elliott Wave Theory analysis are labeled with numbers within trending waves and letters with corrective waves. The subscripts — numbers in curly brackets — designate the wave’s degree, which, in Elliott Wave analysis, means the relative position of a wave within the larger and smaller structures that make up the chart. R.N. Elliott, who in the 1930s developed the form of analysis that bears his name, viewed the chart as a complex structure of smaller waves nested within larger waves, which in turn are nested within still larger waves. In mathematics it’s called a fractal structure, where at every scale the pattern is similar to the others.
Learning and other resources. Elliott Wave analysis provides context, not prophecy. As the 20th century semanticist Alfred Korzybski put it in his book Science and Sanity (1933), “The map is not the territory … The only usefulness of a map depends on similarity of structure between the empirical world and the map.” And I would add, in the ever-changing markets, we can judge that similarity of structure only after the fact.
See the menu page Analytical Methods for a rundown on where to go for information on Elliott Wave analysis.
By Tim Bovee, Portland, Oregon, July 25, 2025
Disclaimer
Tim Bovee, Private Trader tracks the analysis and trades of a private trader for his own accounts. Nothing in this blog constitutes a recommendation to buy or sell stocks, options or any other financial instrument. The only purpose of this blog is to provide education and entertainment.
No trader is ever 100 percent successful in his or her trades. Trading in the stock and option markets is risky and uncertain. Each trader must make trading decisions for his or her own account, and take responsibility for the consequences.
All content on Tim Bovee, Private Trader by Timothy K. Bovee is licensed under a Creative Commons Attribution-ShareAlike 4.0 International License.
Based on a work at www.timbovee.com.

You must be logged in to post a comment.