3:30 p.m. New York time
Half an hour before the closing bell. The S&P 500 futures reached a low of 6402.25 in the early hours of the session, rising thereafter until the Federal Open Martket Committee announced its decision to leave the Federal Funds Rate unchanged. The futures fell for 3 minutes from 6424 to 6412.50, and then began to follow a sideways course that peaked at 6420s and fell to the 6410s.
And then, with no visible reason, the price dropped from the 6420 to the 6360s. Perhaps it was a flash-crash, an algorithm gone wrong. Honestly, at this point I have no idea.
Elliott Wave Theory: The rising 4th-wave correction that began on July 29 continued to rise, remaining below the end of the preceding 3rd wave. That’s the principal analysis, same as it was this morning.
The sharp decline less than an hour before the closing bell erased the ambiguity from the chart. Falling wave 5 within falling wave C within the 4th-wave downward correction is underway.
9:35 a.m. New York time.
What’s happening now. The S&P 500 E-mini futures rose overnight, reaching into the 6410s. The Federal Open Market Committee will announce its decision on interest rates at 2 p.m. New York time.
What does it mean? One of the rules of Elliott Wave Theory is that in a three-subwave correction, the 3rd subwave in turn has five subwaves. At present declining wave C is n a 4th-wave upward correction . All of this is happening within a larger 4th-wave downward correction, which ispart of an uptrending 5th wave that began on July 24.
When the 4th subwave within wave C reaches its end, rising wave 5 will begin, carrying wave C to its end, along with its parent, wave 4, and its grand-parent, wave 5.
These are all waves of low degree, so however it plays out, it will all happen quickly.
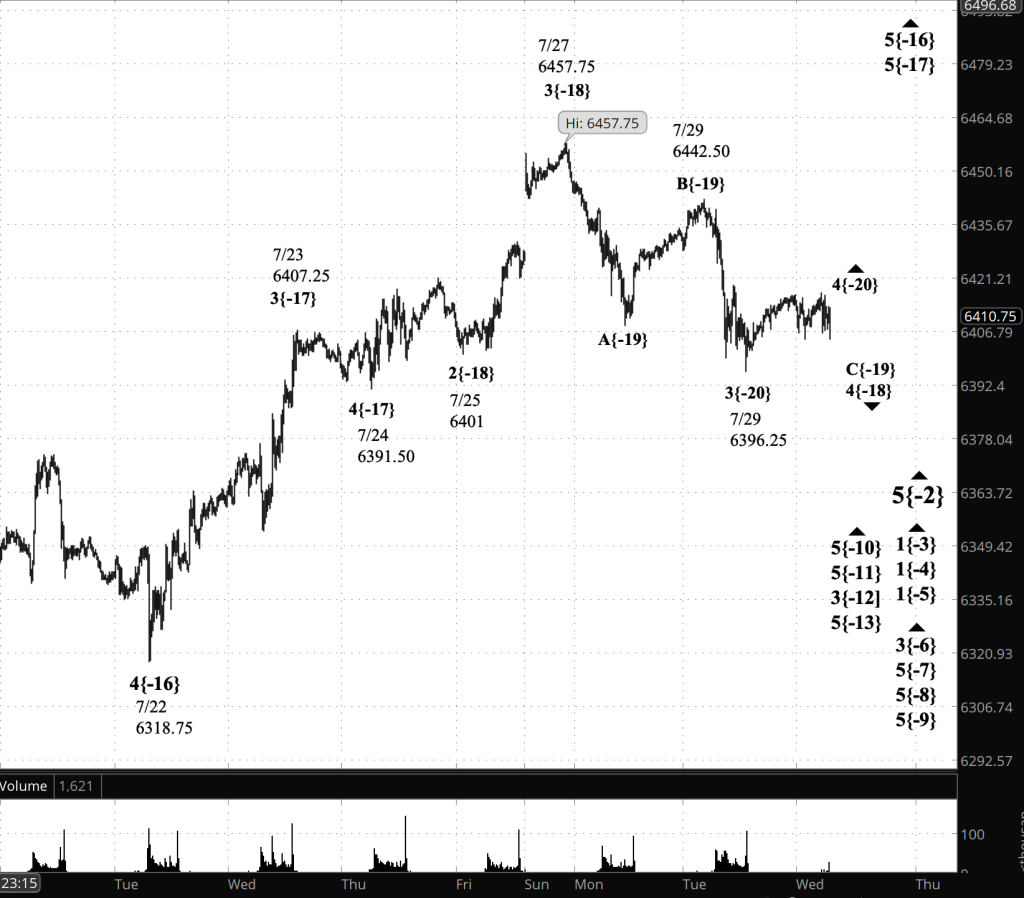
[S&P 500 E-mini futures at 3:30 p.m., 15-minute bars, with volume]
Waves Now Underway
These are the waves currently in progress under my principal analysis. Each line on the list shows the wave number, with the subscript in curly brackets, the traditional degree name, the starting date, the starting price of the S&P 500 E-mini futures, and the direction of the wave.
- S&P 500 Index:
- 5{+3} Supercycle, 7/8/1932, 4.40 (up)
- 5{+2} Cycle, 12/9/1974, 60.96 (up)
- 5{+1} Primary, 3/6/2009, 666.79 (up)
- 5{0} Intermediate, 2/11/2016, 1810.10 (up)
- 3{-1} Minor, 3/23/2020, 2191.36 (up)
- 5{-2} Minute, 4/7/2025, 4832 (up)
- S&P 500 Futures
- 1{-3} Minuette, 4/7/2025, 4832 (up)
- 1{-4} Subminuette, 4/7/2025, 4832 (up)
- 1{-5} Micro, 4/7/2025, 4832 (up)
- 3{-6} Submicro, 4/24/2025, 5260 (up)
- 5{-7} Minuscule, 4/25/2025, 5550 (up)
- 5{-8} (unnamed), 5/7/2025, 5596 (up)
- 5{-9} (unnamed), 5/23/2025, 5756.50 (up)
- 5{-10} (unnamed), 6/22/2025, 5959 (up)
- 5{-11} (unnamed), 6/27/2025, 6183.25 (up)
- 3{-12} (unnamed), 6/30/2025, 6224 (up)
- 5{-13} (unnamed), 7/14/2025, 6529.75 (up)
- 5{-14} (unnamed), 7/16/2025, 6241 (up)
- 3{-15} (unnamed), 7/16/2025, 6288.25 (up)
- 5{-16} (unnamed), 7/22/2025, 6318.75 (up)
- 5{-17} (unnamed), 7/24/2024, 6391.50 (up)
Reading the chart. Price movements — waves – – in Elliott Wave Theory analysis are labeled with numbers within trending waves and letters with corrective waves. The subscripts — numbers in curly brackets — designate the wave’s degree, which, in Elliott Wave analysis, means the relative position of a wave within the larger and smaller structures that make up the chart. R.N. Elliott, who in the 1930s developed the form of analysis that bears his name, viewed the chart as a complex structure of smaller waves nested within larger waves, which in turn are nested within still larger waves. In mathematics it’s called a fractal structure, where at every scale the pattern is similar to the others.
Learning and other resources. Elliott Wave analysis provides context, not prophecy. As the 20th century semanticist Alfred Korzybski put it in his book Science and Sanity (1933), “The map is not the territory … The only usefulness of a map depends on similarity of structure between the empirical world and the map.” And I would add, in the ever-changing markets, we can judge that similarity of structure only after the fact.
See the menu page Analytical Methods for a rundown on where to go for information on Elliott Wave analysis.
By Tim Bovee, Portland, Oregon, July 30, 2025
Disclaimer
Tim Bovee, Private Trader tracks the analysis and trades of a private trader for his own accounts. Nothing in this blog constitutes a recommendation to buy or sell stocks, options or any other financial instrument. The only purpose of this blog is to provide education and entertainment.
No trader is ever 100 percent successful in his or her trades. Trading in the stock and option markets is risky and uncertain. Each trader must make trading decisions for his or her own account, and take responsibility for the consequences.
All content on Tim Bovee, Private Trader by Timothy K. Bovee is licensed under a Creative Commons Attribution-ShareAlike 4.0 International License.
Based on a work at www.timbovee.com.

You must be logged in to post a comment.