3:30 p.m. New York time
Half an hour beforethe closing bell. The S&P 500 futures reversed to the upside during the session, reaching a higher high for the day.
Elliott Wave Theory: The higher high knocked this morning’s analysis — wave 2{-5} on the chart ended and wave 3{-5} has begun — into the trash can of might-have-beens. I’ve adopted a minimalist revision as the new principal count: wave 2{-5} continues and wave 3{-5] has not yet begun..
For minds of a maximalist bent, it is also possible to construct a scenario that has wave 1{-8} as being underway, and I shall give it close look to see if it truly works. Meanwhile, I consider to be an alternative analysis in the making but not quite there yet.
9:35 a.m. New York time.
What’s happening now. The S&P 500 E-mini futures peaked overnight at 6358.25 overnight and then retreated to 6330.
What does it mean? Elliott Wave Theory analysis sees downtrending wave 3, a wave of low degree within the first subwave, wave A, of a 2nd-wave downward correction that began on July 31 from 6468.50. Compared other waves in the structure, I would anticipate wave A to end around 6160 to 6150.
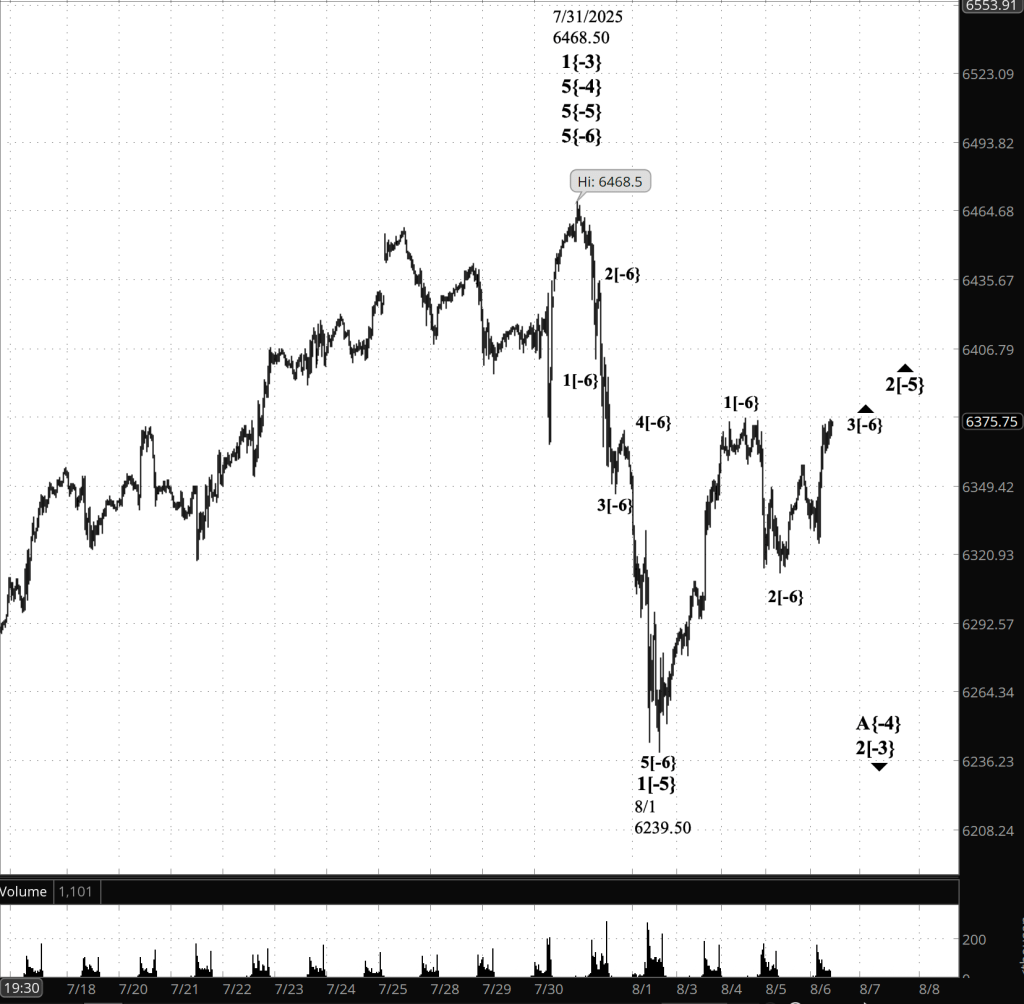
[S&P 500 E-mini futures at 3:30 p.m., 30-minute bars, with volume]
Reading the chart. Price movements — waves – – in Elliott Wave Theory analysis are labeled with numbers within trending waves and letters with corrective waves. The subscripts — numbers in curly brackets — designate the wave’s degree, which, in Elliott Wave analysis, means the relative position of a wave within the larger and smaller structures that make up the chart. R.N. Elliott, who in the 1930s developed the form of analysis that bears his name, viewed the chart as a complex structure of smaller waves nested within larger waves, which in turn are nested within still larger waves. In mathematics it’s called a fractal structure, where at every scale the pattern is similar to the others.
Learning and other resources. Elliott Wave analysis provides context, not prophecy. As the 20th century semanticist Alfred Korzybski put it in his book Science and Sanity (1933), “The map is not the territory … The only usefulness of a map depends on similarity of structure between the empirical world and the map.” And I would add, in the ever-changing markets, we can judge that similarity of structure only after the fact.
See the menu page Analytical Methods for a rundown on where to go for information on Elliott Wave analysis.
By Tim Bovee, Portland, Oregon, August 6, 2025
Disclaimer
Tim Bovee, Private Trader tracks the analysis and trades of a private trader for his own accounts. Nothing in this blog constitutes a recommendation to buy or sell stocks, options or any other financial instrument. The only purpose of this blog is to provide education and entertainment.
No trader is ever 100 percent successful in his or her trades. Trading in the stock and option markets is risky and uncertain. Each trader must make trading decisions for his or her own account, and take responsibility for the consequences.
All content on Tim Bovee, Private Trader by Timothy K. Bovee is licensed under a Creative Commons Attribution-ShareAlike 4.0 International License.
Based on a work at www.timbovee.com.

You must be logged in to post a comment.