3:30 p.m. New York time
Half an hour before the closing bell. The S&P 500 futures reached a low early on of 6362.75, and then worked its way slightly higher, into the 6410s.
Elliott Wave Theory: The idea behind Elliott Wave Theory is that it represents the group mood, and understanding, and fear and optimism of the traders and the people who surround the traders — which is to say everyone — at a given moment in time.
Elliott Wave Theory at this moment in says the mood etc. is somewhat negative, worried that the price has moved too high among many other subjects. It’s a concern that has been with people since August 14. That’s the meaning of the 4th-wave downward correction that began on that date.
Arguably, from the past few days through 10 a.m. New York time on Friday, the mood will focus on Fed Chair Powell and his speech at the Jackson Hole, Wyoming meeting of the Federal Reserve. It is a fear-making time for people who are concerned about how the Federal Reserve is governed and what it means for the value of our currency, and so yes, Elliott Wave Theory has numbers and rules and a certain sense of inevitability. And yet, above all, it’s the product of people. Look at a stock chart, and you can know, instantly, what their mood is. And we’ll get a super dose of mood and response come Friday.
9:35 a.m. New York time.
What’s happening now. The S&P 500 E-mini futures continued a gentle fall overnight, reaching a low of 6408.
What does it mean? Elliott Wave Theory analysis concludes that the 4th-wave downward correction that began on August 14 continues. Within wave 4, things are less clear. It seems to be that wave 4 is still in its initial subwave, wave A, but I would have difficulty mapping the internals. It’s almost as through the futures were awaiting, with a bearish tilt, Friday’s speech by Fed Chair Powell at Friday’s Jackson Hole, Wyoming meeting of the Federal Reserve leadership. Powell is scheduled to speak at 10 a.m. Eastern time. The title of his speech: “Economic Outlook and Framework Review”.
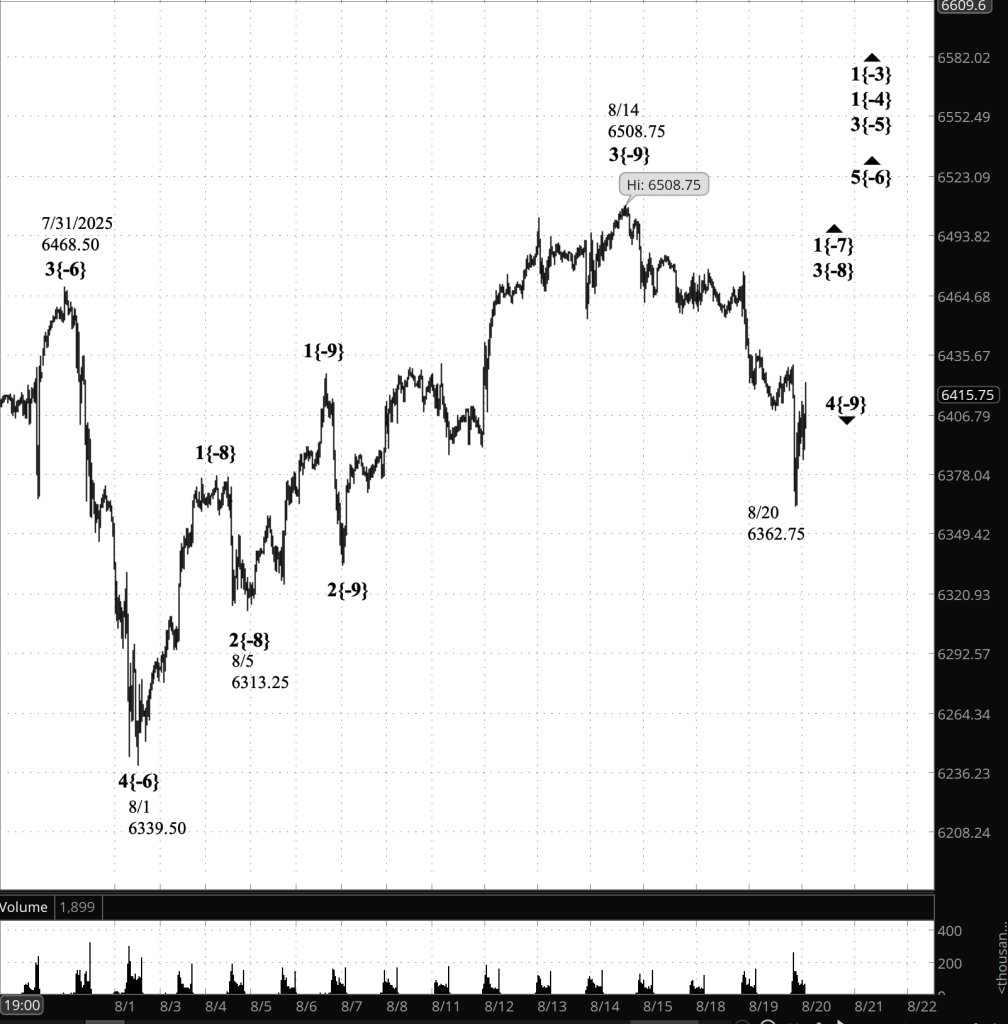
[S&P 500 E-mini futures at 3:30 p.m., 35-minute bars, with volume]
Waves Now Underway
These are the waves currently in progress under my principal analysis. Each line on the list shows the wave number, with the subscript in curly brackets, the traditional degree name, the starting date, the starting price of the S&P 500 E-mini futures, and the direction of the wave.
- S&P 500 Index:
- 5{+3} Supercycle, 7/8/1932, 4.40 (up)
- 5{+2} Cycle, 12/9/1974, 60.96 (up)
- 5{+1} Primary, 3/6/2009, 666.79 (up)
- 5{0} Intermediate, 2/11/2016, 1810.10 (up)
- 3{-1} Minor, 3/23/2020, 2191.36 (up)
- 1{-2} Minute, 7/31/2025, 6468.50 (down)
- S&P 500 Futures
- 1{-3} Minuette, 10/13/2022, 4603 (up)
- 1{-4} Subminuette, 4/7/2025, 4832 (up)
- 3{-5} Micro, 4/21/2025, 5127.25 (up)
- 5{-6} Submicro, 8/1/2025, 6249.50 (up)
- 1{-7} Minuscule, 8/1/2025, 6349.50 (up)
- 3{-8} (unnamed), 8/5/2025, 6313.25 (up)
- 4{-9} (unnamed), 8/14/2025, 6508.75
Reading the chart. Price movements — waves – – in Elliott Wave Theory analysis are labeled with numbers within trending waves and letters with corrective waves. The subscripts — numbers in curly brackets — designate the wave’s degree, which, in Elliott Wave analysis, means the relative position of a wave within the larger and smaller structures that make up the chart. R.N. Elliott, who in the 1930s developed the form of analysis that bears his name, viewed the chart as a complex structure of smaller waves nested within larger waves, which in turn are nested within still larger waves. In mathematics it’s called a fractal structure, where at every scale the pattern is similar to the others.
Learning and other resources. Elliott Wave analysis provides context, not prophecy. As the 20th century semanticist Alfred Korzybski put it in his book Science and Sanity (1933), “The map is not the territory … The only usefulness of a map depends on similarity of structure between the empirical world and the map.” And I would add, in the ever-changing markets, we can judge that similarity of structure only after the fact.
See the menu page Analytical Methods for a rundown on where to go for information on Elliott Wave analysis.
By Tim Bovee, Portland, Oregon, August 20, 2025
Disclaimer
Tim Bovee, Private Trader tracks the analysis and trades of a private trader for his own accounts. Nothing in this blog constitutes a recommendation to buy or sell stocks, options or any other financial instrument. The only purpose of this blog is to provide education and entertainment.
No trader is ever 100 percent successful in his or her trades. Trading in the stock and option markets is risky and uncertain. Each trader must make trading decisions for his or her own account, and take responsibility for the consequences.
All content on Tim Bovee, Private Trader by Timothy K. Bovee is licensed under a Creative Commons Attribution-ShareAlike 4.0 International License.
Based on a work at www.timbovee.com

You must be logged in to post a comment.