3:30 p.m. New York time
Half an hour before the closing bell. The S&P 500 futures traded within a narrow range during the session. Elliott Wave Theory: The movement is consistent with falling wave C being underway, while leaving open the possibility that wave B will continue its rise.
I think wave C has the strongest case in its favor, and assuming events play out that way, here are some estimates about how far C can fall. Often, waves A and C have about the same length, giving C a likely endpoint around 6350. Sometimes, wave C is more extensive, running a Fibonacci multiplier more than the length of A, carrying wave C down to 6260. There’s an area of clusternng between 6310 and 6350 which may encompass the end point.
Once wave C is complete, it’s likely that wave 4 will also be complete. Uptrending wave 5 will follow, carrying the uptrending parent wave 3 and the uptrending grandparent wave 1 further toward their goals.
9:35 a.m. New York time.
What’s happening now. The S&P 500 E-mini futures fell from the 6490s to to the 6460s after trading resumed overnight.
What does it mean? Elliott Wave Theory analysis suggests that there are two possible interpretations of the chart.
One sees the August 22 peak, 6496.25, as the end of the middle subwave, wave B, of the 4th-wave downward correction that began on August 14, and declining wave C as being underway. I’ve adopted this as my principle analysis, as reflected in the mark-up of the chart The alternative analysis sees the present, shallow decline as a subwave within still-underway wave B, which is still underway.
If the decline continues, the wave C scenario is confirmed. If the price reverses and rises to a new high, the wave B scenario is confirmed.
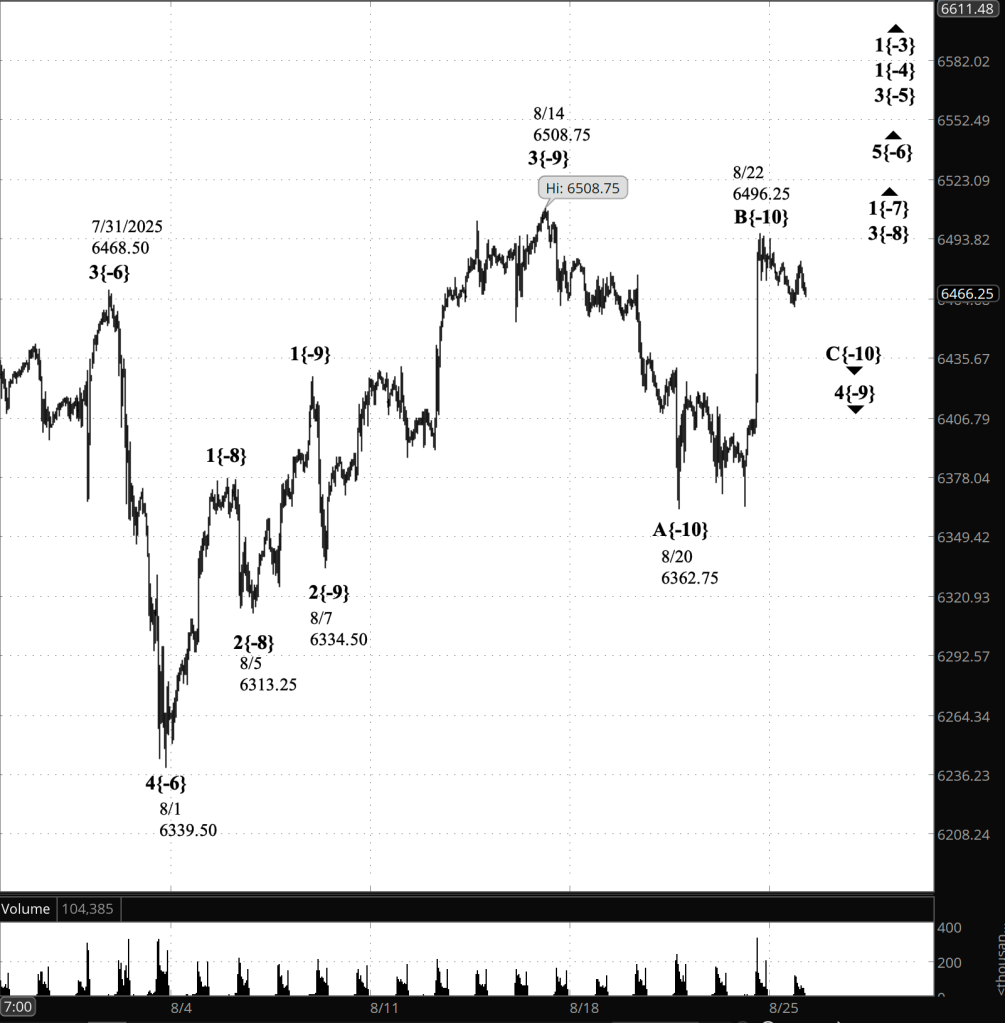
[S&P 500 E-mini futures at 3:30 p.m., 45-minute bars, with volume]
Waves Now Underway
These are the waves currently in progress under my principal analysis. Each line on the list shows the wave number, with the subscript in curly brackets, the traditional degree name, the starting date, the starting price of the S&P 500 E-mini futures, and the direction of the wave.
- S&P 500 Index:
- 5{+3} Supercycle, 7/8/1932, 4.40 (up)
- 5{+2} Cycle, 12/9/1974, 60.96 (up)
- 5{+1} Primary, 3/6/2009, 666.79 (up)
- 5{0} Intermediate, 2/11/2016, 1810.10 (up)
- 3{-1} Minor, 3/23/2020, 2191.36 (up)
- 1{-2} Minute, 7/31/2025, 6468.50 (down)
- S&P 500 Futures
- 1{-3} Minuette, 10/13/2022, 4603 (up)
- 1{-4} Subminuette, 4/7/2025, 4832 (up)
- 3{-5} Micro, 4/21/2025, 5127.25 (up)
- 5{-6} Submicro, 8/1/2025, 6249.50 (up)
- 1{-7} Minuscule, 8/1/2025, 6349.50 (up)
- 3{-8} (unnamed), 8/5/2025, 6313.25 (up)
- 4{-9} (unnamed), 8/14/2025, 6508.75 (down)
- C{-10} (unnamed), 8/22/2025, 6496.25 (down)
Reading the chart. Price movements — waves – – in Elliott Wave Theory analysis are labeled with numbers within trending waves and letters with corrective waves. The subscripts — numbers in curly brackets — designate the wave’s degree, which, in Elliott Wave analysis, means the relative position of a wave within the larger and smaller structures that make up the chart. R.N. Elliott, who in the 1930s developed the form of analysis that bears his name, viewed the chart as a complex structure of smaller waves nested within larger waves, which in turn are nested within still larger waves. In mathematics it’s called a fractal structure, where at every scale the pattern is similar to the others.
Learning and other resources. Elliott Wave analysis provides context, not prophecy. As the 20th century semanticist Alfred Korzybski put it in his book Science and Sanity (1933), “The map is not the territory … The only usefulness of a map depends on similarity of structure between the empirical world and the map.” And I would add, in the ever-changing markets, we can judge that similarity of structure only after the fact.
See the menu page Analytical Methods for a rundown on where to go for information on Elliott Wave analysis.
By Tim Bovee, Portland, Oregon, August 25, 2025
Disclaimer
Tim Bovee, Private Trader tracks the analysis and trades of a private trader for his own accounts. Nothing in this blog constitutes a recommendation to buy or sell stocks, options or any other financial instrument. The only purpose of this blog is to provide education and entertainment.
No trader is ever 100 percent successful in his or her trades. Trading in the stock and option markets is risky and uncertain. Each trader must make trading decisions for his or her own account, and take responsibility for the consequences.
All content on Tim Bovee, Private Trader by Timothy K. Bovee is licensed under a Creative Commons Attribution-ShareAlike 4.0 International License.
Based on a work at www.timbovee.com

You must be logged in to post a comment.