3:30 p.m. New York time
Half an hour before the closing bell. The S&P 500 futures pulled back from its early session high, 6541.75, and then began to pick up speed as it fell further, reaching a low so far of 6452.
Elliott Wave Theory: The early session peak ended the 4th-wave upward correction, that began on September 2, and it was the beginning of the downtrending 5th wave, both subwaves within wave C{-10}, the final subwave of a larger 4th-wave downward correction, wave 4{-9}, which began on August 14 and which is still underway.
The end of wave 5{-11} will also be the end of wave C{-10} and most likely of wave 4{-9}. It will mark the start of a larger uptrending 5th wave that will carry the price back into the 6500s and most likely significantly higher.
Back to the present smaller downtrending 5th wave. How low can it go? One possible stopping point is roughly 6370 to 6380, which is a Fibonacci 1.618 retracement of the preceding 3rd wave, and it might also go as low as the neighborhood of 6330 to 6350.
It’s an estimate, not a hard-core forecast.
And of course, there’s always the surprise. It could turn out that today’s peak is a subwave buried in wave 4{-11}. A rise above 6541.75 would mean that wave 4{-11} is still underway, and wave 5{-11} still lies in the future.
9:35 a.m. New York time.
What’s happening now. When the Employment Situation Report was published an hour before the opening bell, the S&P 500 E-mini futures whipsawed across 32 points, down and then up, and then continued to rise into the 6540s.
What does it mean? The Elliott Wave Theory analysis shows clearly the the final subwave, wave C, continues within the 4th-wave upward correction that began on September 2. When the C wave is complete, it will be the end of the corrective pattern as well as the 4th wave, and the beginning of a downtrending 5th wave.
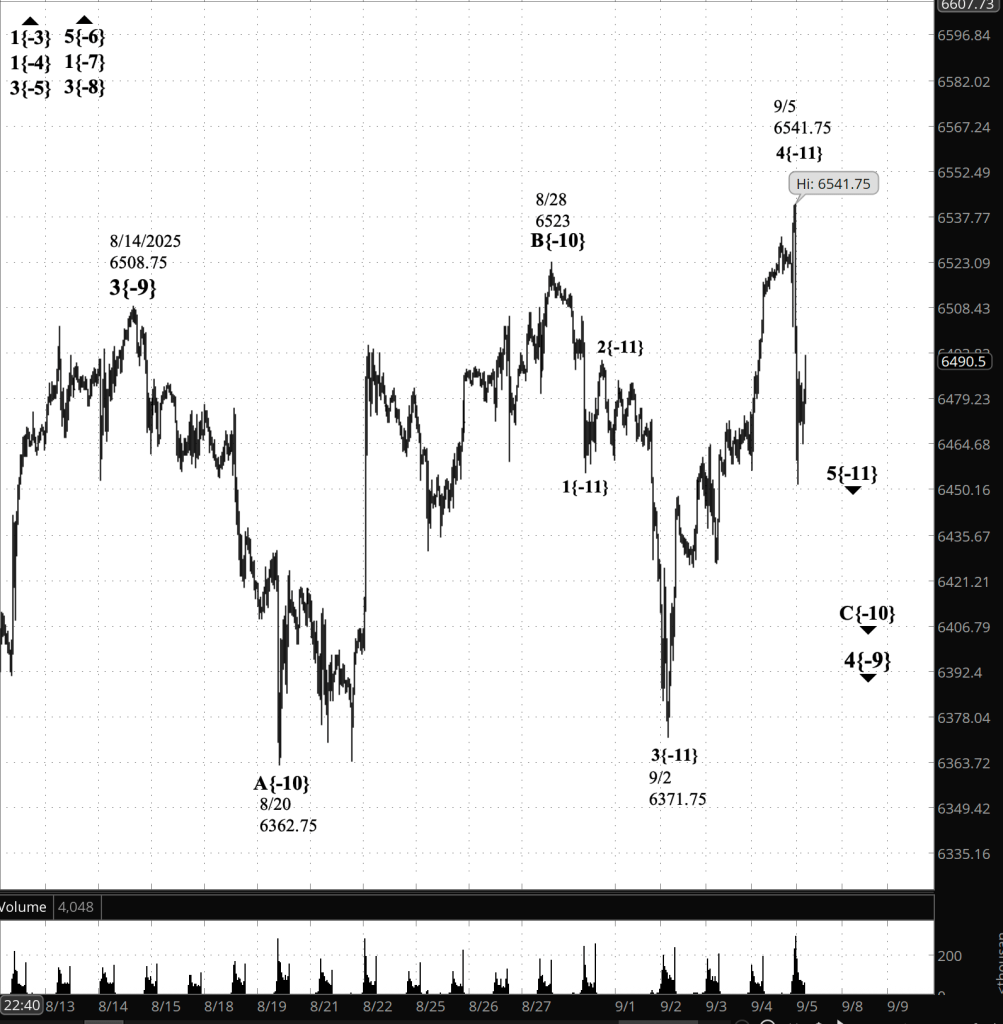
[S&P 500 E-mini futures at 3:30 p.m.,40-minute bars, with volume]
Waves Now Underway
These are the waves currently in progress under my principal analysis. Each line on the list shows the wave number, with the subscript in curly brackets, the traditional degree name, the starting date, the starting price of the S&P 500 E-mini futures, and the direction of the wave.
- S&P 500 Index:
- 5{+3} Supercycle, 7/8/1932, 4.40 (up)
- 5{+2} Cycle, 12/9/1974, 60.96 (up)
- 5{+1} Primary, 3/6/2009, 666.79 (up)
- 5{0} Intermediate, 2/11/2016, 1810.10 (up)
- 3{-1} Minor, 3/23/2020, 2191.36 (up)
- 1{-2} Minute, 7/31/2025, 6468.50 (down)
- S&P 500 Futures
- 1{-3} Minuette, 10/13/2022, 4603 (up)
- 1{-4} Subminuette, 4/7/2025, 4832 (up)
- 3{-5} Micro, 4/21/2025, 5127.25 (up)
- 5{-6} Submicro, 8/1/2025, 6249.50 (up)
- 1{-7} Minuscule, 8/1/2025, 6349.50 (up)
- 3{-8} (unnamed), 8/5/2025, 6313.25 (up)
- 4{-9} (unnamed), 8/14/2025, 6508.75 (down)
- C{-10} (unnamed), 8/28/2025, 6523 (down)
- 5{-11} (unnamed), 9/5/2025, 6541.75 (down)
Reading the chart. Price movements — waves – – in Elliott Wave Theory analysis are labeled with numbers within trending waves and letters with corrective waves. The subscripts — numbers in curly brackets — designate the wave’s degree, which, in Elliott Wave analysis, means the relative position of a wave within the larger and smaller structures that make up the chart. R.N. Elliott, who in the 1930s developed the form of analysis that bears his name, viewed the chart as a complex structure of smaller waves nested within larger waves, which in turn are nested within still larger waves. In mathematics it’s called a fractal structure, where at every scale the pattern is similar to the others.
Learning and other resources. Elliott Wave analysis provides context, not prophecy. As the 20th century semanticist Alfred Korzybski put it in his book Science and Sanity (1933), “The map is not the territory … The only usefulness of a map depends on similarity of structure between the empirical world and the map.” And I would add, in the ever-changing markets, we can judge that similarity of structure only after the fact.
See the menu page Analytical Methods for a rundown on where to go for information on Elliott Wave analysis.
By Tim Bovee, Portland, Oregon, September 5, 2025
Disclaimer
Tim Bovee, Private Trader tracks the analysis and trades of a private trader for his own accounts. Nothing in this blog constitutes a recommendation to buy or sell stocks, options or any other financial instrument. The only purpose of this blog is to provide education and entertainment.
No trader is ever 100 percent successful in his or her trades. Trading in the stock and option markets is risky and uncertain. Each trader must make trading decisions for his or her own account, and take responsibility for the consequences.
All content on Tim Bovee, Private Trader by Timothy K. Bovee is licensed under a Creative Commons Attribution-ShareAlike 4.0 International License.
Based on work at www.timbovee.com

You must be logged in to post a comment.