3:30 p.m. New York time
Half an hour before the closing bell. The S&P 500 futures continued to decline, from the overnight peak, 6696.76, so far reaching a low of 6661.25 during the session.
Elliott Wave Theory: The size of the decline is similar in size to other declning subwaves with wave C, itself a subwave within a 4th-wave downward correction. Long story short: It strengthen the possibility, by a little, that wave C ended at the overnight peak, but evidence is still quite weak.
Perhaps the Federal Open Market Committee’s interest-rate decision on Wednesday at 2 p.m. New York time will produce a market response that will clarify the chart.
9:35 a.m. New York time.
What’s happening now. Another day, another new high. The S&P 500 E-mini futures rose to a new high overnight, 6696.75.
What does it mean? Elliott Wave Theory analysis sees rising wave C within a 4th-wave upward correction as still being under way, as it has been since September 5.
And within wave C, the ambiguity in the count remains. is wave C in its 3rd subwave or its 5th? I find it impossible to say for certain.
If it’s wave 3, then I would expect it to reach it’s end fairly soon, to be followed by a shallow 4th-wave downward correction and then by wave 5. If it’s wave 5 that’s now underway, then I would expect wave C and its parent 4th-wave upward correction to both end soon, to be followed by a larger downtrending 5th wave (to be numbered 5{-11} on the chart).
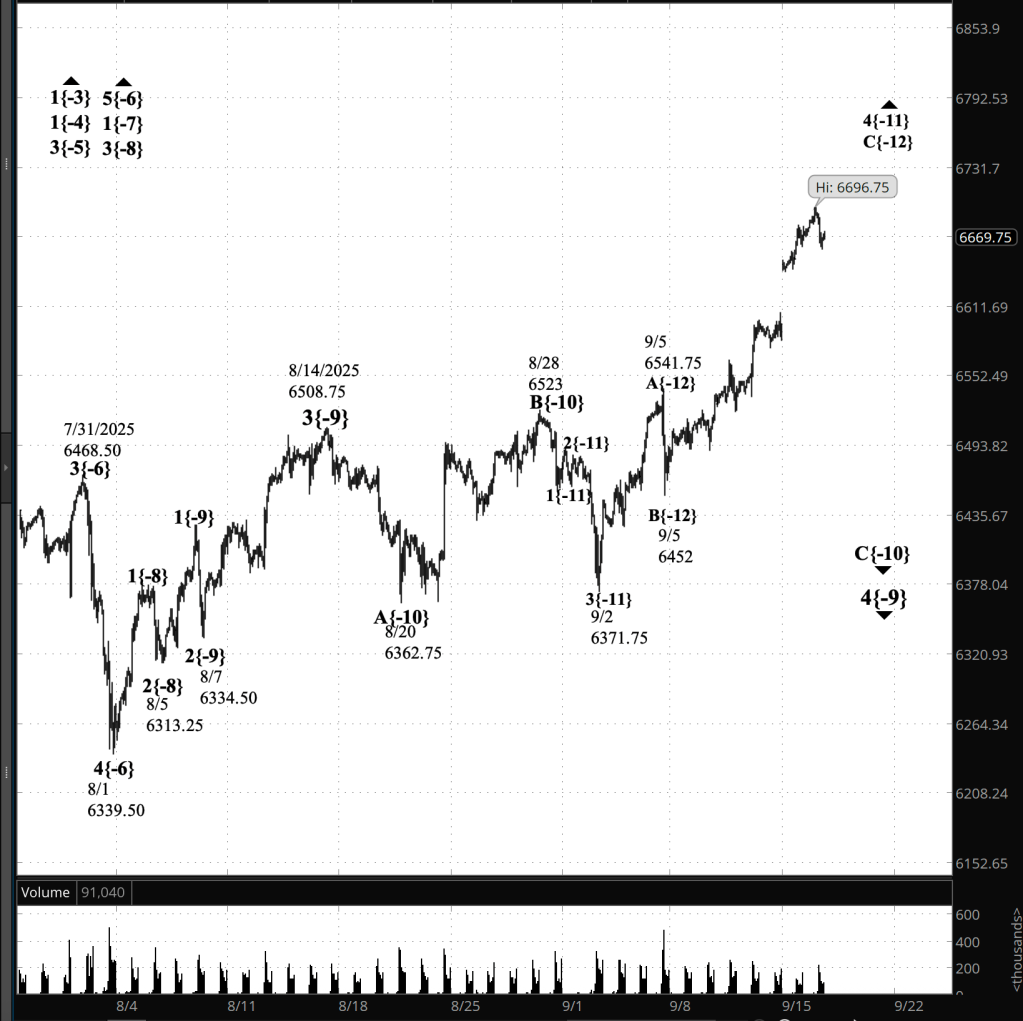
[S&P 500 E-mini futures at 3:30 p.m., 80-minute bars, with volume]
Waves Now Underway
These are the waves currently in progress under my principal analysis. Each line on the list shows the wave number, with the subscript in curly brackets, the traditional degree name, the starting date, the starting price of the S&P 500 E-mini futures, and the direction of the wave.
- S&P 500 Index:
- 5{+3} Supercycle, 7/8/1932, 4.40 (up)
- 5{+2} Cycle, 12/9/1974, 60.96 (up)
- 5{+1} Primary, 3/6/2009, 666.79 (up)
- 5{0} Intermediate, 2/11/2016, 1810.10 (up)
- 3{-1} Minor, 3/23/2020, 2191.36 (up)
- 1{-2} Minute, 7/31/2025, 6468.50 (down)
- S&P 500 Futures
- 1{-3} Minuette, 10/13/2022, 4603 (up)
- 1{-4} Subminuette, 4/7/2025, 4832 (up)
- 3{-5} Micro, 4/21/2025, 5127.25 (up)
- 5{-6} Submicro, 8/1/2025, 6249.50 (up)
- 1{-7} Minuscule, 8/1/2025, 6349.50 (up)
- 3{-8} (unnamed), 8/5/2025, 6313.25 (up)
- 4{-9} (unnamed), 8/14/2025, 6508.75 (down)
- C{-10} (unnamed), 8/28/2025, 6523 (down)
- 4{-11} (unnamed), 9/2/2025, 6371.75 (up)
- C{-12} (unnamed), 9/5/2025, 6452 (up)
Reading the chart. Price movements — waves – – in Elliott Wave Theory analysis are labeled with numbers within trending waves and letters with corrective waves. The subscripts — numbers in curly brackets — designate the wave’s degree, which, in Elliott Wave analysis, means the relative position of a wave within the larger and smaller structures that make up the chart. R.N. Elliott, who in the 1930s developed the form of analysis that bears his name, viewed the chart as a complex structure of smaller waves nested within larger waves, which in turn are nested within still larger waves. In mathematics it’s called a fractal structure, where at every scale the pattern is similar to the others.
Learning and other resources. Elliott Wave analysis provides context, not prophecy. As the 20th century semanticist Alfred Korzybski put it in his book Science and Sanity (1933), “The map is not the territory … The only usefulness of a map depends on similarity of structure between the empirical world and the map.” And I would add, in the ever-changing markets, we can judge that similarity of structure only after the fact.
See the menu page Analytical Methods for a rundown on where to go for information on Elliott Wave analysis.
By Tim Bovee, Portland, Oregon, September 16, 2025
Disclaimer
Tim Bovee, Private Trader tracks the analysis and trades of a private trader for his own accounts. Nothing in this blog constitutes a recommendation to buy or sell stocks, options or any other financial instrument. The only purpose of this blog is to provide education and entertainment.
No trader is ever 100 percent successful in his or her trades. Trading in the stock and option markets is risky and uncertain. Each trader must make trading decisions for his or her own account, and take responsibility for the consequences.
All content on Tim Bovee, Private Trader by Timothy K. Bovee is licensed under a Creative Commons Attribution-ShareAlike 4.0 International License.
Based on work at www.timbovee.com

You must be logged in to post a comment.