3:30 p.m. New York time
Half an hour before the closing bell. The S&P 500 futures whipsawed when the Federal Open Market Committee did as expected by raising the Fed Funds interest rate by 25 basis points.
Elliott Wave Theory: The price rose then fell after the announcement. The rise failed to exceed the peak in the rise that began on September 5, wave C within the 4th-wave upward correction. The fall has carried the price so far into the 6610s.
I’ve relabelled the chart to show wave C and wave 4 both ended, and downtrending wave 5 began. This wave 5 — 5{-11} on the chart — have a length pulled from a wide variety of possibilities. At this point an endpoint around of around 6350 seems likely, based on a wave 4 extension. But an endpoint around 6500 or around 6170 is possible. At this early point in wave 5 there’s not a lot of certainty.
9:35 a.m. New York time.
What’s happening now. The S&P 500 E-mini futures fell overnight from the 6670s into the 6650s and then retraced a portion of the decline, as though marking time until the Federal Open Market Committee announces its decision on interest rates. The decision will be announced at 2 p.m. New York time. Federal Reserve Chair Jerome Powell will hold a news conference beginning at 2:30 p.m.
What does it mean? Elliott Wave Theory. On the chart I’ve moved closer in so as to get a better sense of the internal structure of wave C and its parent, a 4th-wave upward correction that began on September 2. The question this morning is whether or not wave 4 has ended at its latest peak, 6696.75 on September 16. In my view the present drop is ambiguous on the the matter. Perhaps the response to the FOMC announcement will clarify the chart.
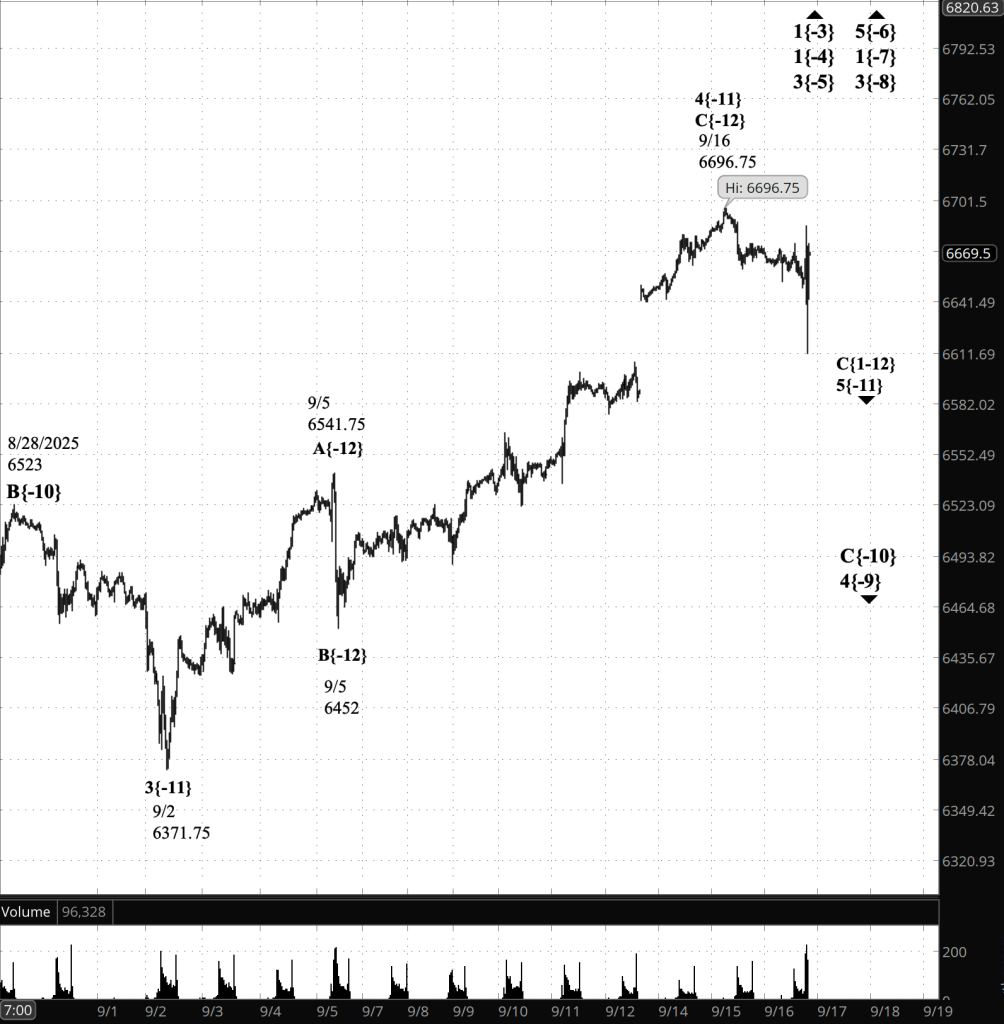
[S&P 500 E-mini futures at 3:30 p.m., 80-minute bars, with volume]
Waves Now Underway
These are the waves currently in progress under my principal analysis. Each line on the list shows the wave number, with the subscript in curly brackets, the traditional degree name, the starting date, the starting price of the S&P 500 E-mini futures, and the direction of the wave.
- S&P 500 Index:
- 5{+3} Supercycle, 7/8/1932, 4.40 (up)
- 5{+2} Cycle, 12/9/1974, 60.96 (up)
- 5{+1} Primary, 3/6/2009, 666.79 (up)
- 5{0} Intermediate, 2/11/2016, 1810.10 (up)
- 3{-1} Minor, 3/23/2020, 2191.36 (up)
- 1{-2} Minute, 7/31/2025, 6468.50 (down)
- S&P 500 Futures
- 1{-3} Minuette, 10/13/2022, 4603 (up)
- 1{-4} Subminuette, 4/7/2025, 4832 (up)
- 3{-5} Micro, 4/21/2025, 5127.25 (up)
- 5{-6} Submicro, 8/1/2025, 6249.50 (up)
- 1{-7} Minuscule, 8/1/2025, 6349.50 (up)
- 3{-8} (unnamed), 8/5/2025, 6313.25 (up)
- 4{-9} (unnamed), 8/14/2025, 6508.75 (down)
- C{-10} (unnamed), 8/28/2025, 6523 (down)
- 5{-11} (unnamed), 9/16/2025, 6696.75 (down)
- 1{-12} (unnamed), 9/16/2025, 6696.75 (down)
Reading the chart. Price movements — waves – – in Elliott Wave Theory analysis are labeled with numbers within trending waves and letters with corrective waves. The subscripts — numbers in curly brackets — designate the wave’s degree, which, in Elliott Wave analysis, means the relative position of a wave within the larger and smaller structures that make up the chart. R.N. Elliott, who in the 1930s developed the form of analysis that bears his name, viewed the chart as a complex structure of smaller waves nested within larger waves, which in turn are nested within still larger waves. In mathematics it’s called a fractal structure, where at every scale the pattern is similar to the others.
Learning and other resources. Elliott Wave analysis provides context, not prophecy. As the 20th century semanticist Alfred Korzybski put it in his book Science and Sanity (1933), “The map is not the territory … The only usefulness of a map depends on similarity of structure between the empirical world and the map.” And I would add, in the ever-changing markets, we can judge that similarity of structure only after the fact.
See the menu page Analytical Methods for a rundown on where to go for information on Elliott Wave analysis.
By Tim Bovee, Portland, Oregon, September 17, 2025
Disclaimer
Tim Bovee, Private Trader tracks the analysis and trades of a private trader for his own accounts. Nothing in this blog constitutes a recommendation to buy or sell stocks, options or any other financial instrument. The only purpose of this blog is to provide education and entertainment.
No trader is ever 100 percent successful in his or her trades. Trading in the stock and option markets is risky and uncertain. Each trader must make trading decisions for his or her own account, and take responsibility for the consequences.
All content on Tim Bovee, Private Trader by Timothy K. Bovee is licensed under a Creative Commons Attribution-ShareAlike 4.0 International License.
Based on work at www.timbovee.com

You must be logged in to post a comment.