3:30 p.m. New York time
Half an hour before the closing bell. The S&P 500 futures continued to fall during the session, reaching a low so far of 6678.
Elliott Wave Theory: The decline is sufficient to change the analysis. The 4th wave upward correction that began on September 2 ended two days ago, on September 22, and at that point downtrending wave 5 began from 6756.75.
So what could go wrong? The usual ambiguities when a wave reaches its peak. Is it really the peak, or is there a bit more upward energy in its movement?
If wave 5 continue to drop, we know the new analysis is correct. If the decline reverses and the price moves beyond the peak, then we know that rising wave 4 is still underway.
9:35 a.m. New York time.
What’s happening now. The S&P 500 E-mini futures rose from the 6710s into the 6720s overnight. The rise kept the price well below the all-time high, 6756.75, set on September 22.
What does it mean? Elliott Wave Theory analysis is at a turning point. It could be that wave 4, an upward correction that began on September 2, is still underway. Equally, it could be that wave 4 has ended and downtrending wave 5 has begun.
The further the price falls, the more likely it is that wave 5 is underway. Meanwhile, I’m keep the chart labelled to show wave 4 is underway, until the movement shows that to no longer be the case.
In some ways, Elliott Wave Theory analysis is a simple method.
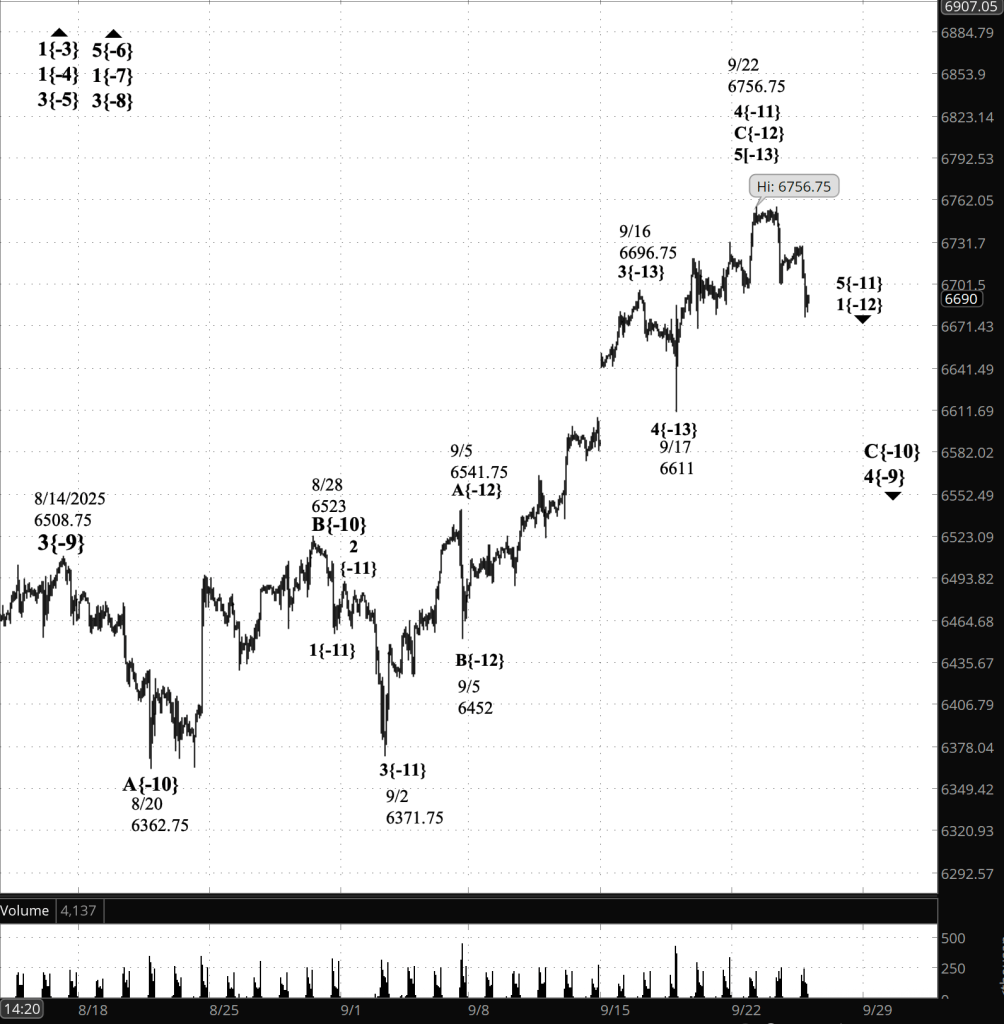
[S&P 500 E-mini futures at 3:30 p.m…m., 70-minute bars, with volume]
Waves Now Underway
Updated for the afternoon analysis, which shows wave 4{-11} having ended and wave 5{-11} having begun.
These are the waves currently in progress under my principal analysis. Each line on the list shows the wave number, with the subscript in curly brackets, the traditional degree name, the starting date, the starting price of the S&P 500 E-mini futures, and the direction of the wave.
- S&P 500 Index:
- 5{+3} Supercycle, 7/8/1932, 4.40 (up)
- 5{+2} Cycle, 12/9/1974, 60.96 (up)
- 5{+1} Primary, 3/6/2009, 666.79 (up)
- 5{0} Intermediate, 2/11/2016, 1810.10 (up)
- 3{-1} Minor, 3/23/2020, 2191.36 (up)
- 1{-2} Minute, 7/31/2025, 6468.50 (down)
- S&P 500 Futures
- 1{-3} Minuette, 10/13/2022, 4603 (up)
- 1{-4} Subminuette, 4/7/2025, 4832 (up)
- 3{-5} Micro, 4/21/2025, 5127.25 (up)
- 5{-6} Submicro, 8/1/2025, 6249.50 (up)
- 1{-7} Minuscule, 8/1/2025, 6349.50 (up)
- 3{-8} (unnamed), 8/5/2025, 6313.25 (up)
- 4{-9} (unnamed), 8/14/2025, 6508.75 (down)
- C{-10} (unnamed), 8/28/2025, 6523 (down)
- 5{-11} (unnamed), 9/22/2025, 6371.75 (down)
- 1{-12} (unnamed), 9/22/2025, 6371.75 (down)
Reading the chart. Price movements — waves – – in Elliott Wave Theory analysis are labeled with numbers within trending waves and letters with corrective waves. The subscripts — numbers in curly brackets — designate the wave’s degree, which, in Elliott Wave analysis, means the relative position of a wave within the larger and smaller structures that make up the chart. R.N. Elliott, who in the 1930s developed the form of analysis that bears his name, viewed the chart as a complex structure of smaller waves nested within larger waves, which in turn are nested within still larger waves. In mathematics it’s called a fractal structure, where at every scale the pattern is similar to the others.
Learning and other resources. Elliott Wave analysis provides context, not prophecy. As the 20th century semanticist Alfred Korzybski put it in his book Science and Sanity (1933), “The map is not the territory … The only usefulness of a map depends on similarity of structure between the empirical world and the map.” And I would add, in the ever-changing markets, we can judge that similarity of structure only after the fact.
See the menu page Analytical Methods for a rundown on where to go for information on Elliott Wave analysis.
By Tim Bovee, Portland, Oregon, September 24, 2025
Disclaimer
Tim Bovee, Private Trader tracks the analysis and trades of a private trader for his own accounts. Nothing in this blog constitutes a recommendation to buy or sell stocks, options or any other financial instrument. The only purpose of this blog is to provide education and entertainment.
No trader is ever 100 percent successful in his or her trades. Trading in the stock and option markets is risky and uncertain. Each trader must make trading decisions for his or her own account, and take responsibility for the consequences.
All content on Tim Bovee, Private Trader by Timothy K. Bovee is licensed under a Creative Commons Attribution-ShareAlike 4.0 International License.
Based on work at www.timbovee.com

You must be logged in to post a comment.