5:35 p.m. New York time
Note: I’m posted my afternoon analysis early because of a medical appointment. Here’s a third analysis covering subsequent moves of the S&P 500 futures.
Elliott Wave Theory: The initial, declining subwave rose slightly after reaching the day’s low during the session, from 6760.75 and so far has reached into the 6770s.
The wave structure, most likely, from lower degree to higher degree, is most likely this: Wave 4{-17} within wave 1{-16} within wave 1{-15} with wave X{-14} within a rising 4th-wave wave compound correction.
2:30 p.m. New York time
90-minutes before the closing bell. The market has continued lower through the late morning, reaching 6760.75 so far in the session. The decline from 6812.25 now displays clear impulsive characteristics on the 30-minute chart, with shallow retracements and expanding downside momentum. Filtered through Elliott Wave Theory, these traits suggest that wave C{−14} has most likely concluded, and that wave X{−14} is now underway.
The parent wave, 4{-13}, is a complex correction. Wave C{-13} is the end of the first three-wave corrective pattern, the X-wave now under way is a connecting wave, and after X the correction will move into a second three-wave corrective pattern, and perhaps another X-wave and a third pattern before wave 4 is complete.
Momentum indicators support this interpretation: the 30-minute and hourly RSI readings have dropped decisively below 50 without forming bullish divergence, while the MACD histogram continues to widen on the downside. As long as the futures remains beneath 6775, the working assumption is that X{−14}/1{−16} is in progress.
However, should the price recover above 6810 before the close, an alternate view would regain plausibility — that C{−14} is extending as a diagonal, implying another short-term head-fake before the larger correction resumes.
9:35 a.m. New York time.
What’s happening now. The S&P 500 E-mini futures rose to a higher high overnight, peaking at 6812.25, and then pulling back slightly into the 6890s.
What does it mean? That X-wave beginning discussed yesterday? Never happened. The new peak, when Elliott Wave Theory analysis, turns out to be a continuing rise that followed the end of a subwave within wave B, which in turn is the middle subwave within a larger wave C, which began on September 30 from 6680.
In other words, yet another hread-fae.
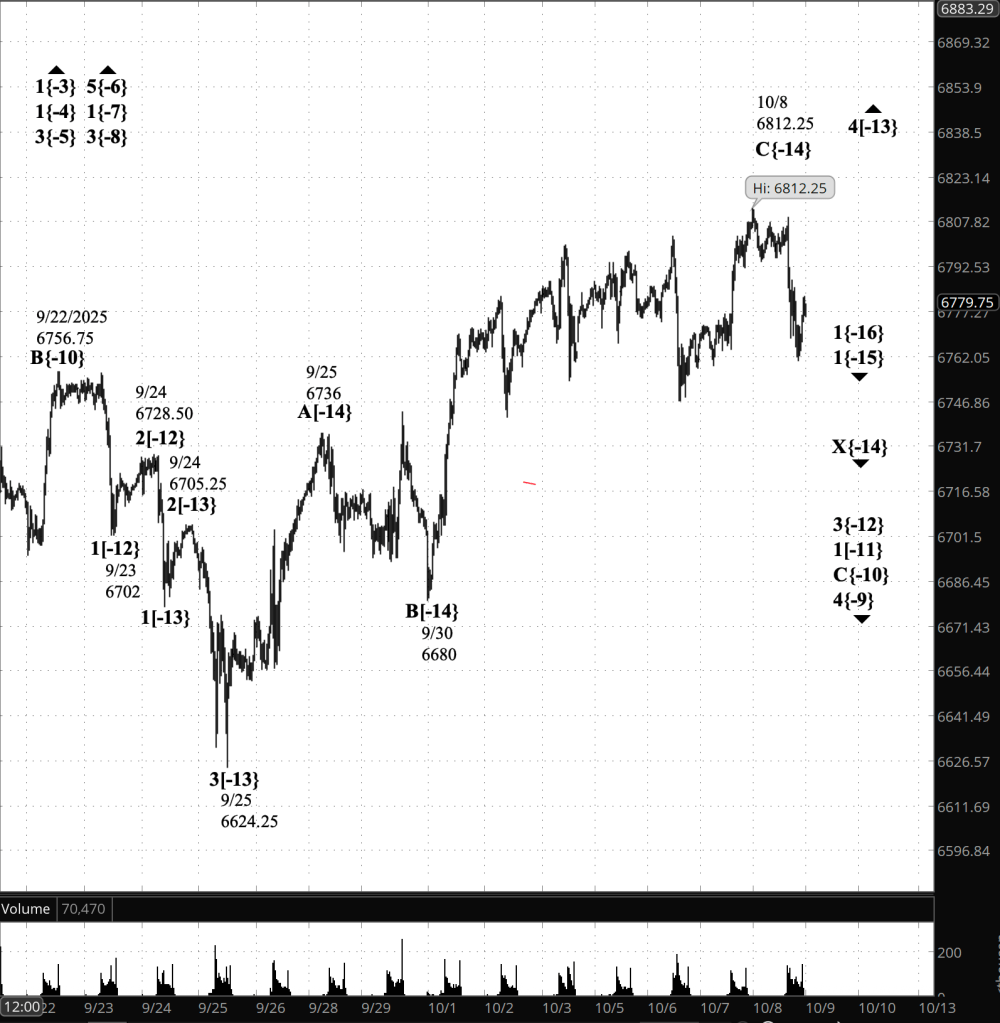
[S&P 500 E-mini futures at 5:35 p.m., 30-minute bars, with volume]
Waves Now Underway
[Updated for afternoon filing to reflect the onset of wave X{-14}.]
These are the waves currently in progress under my principal analysis. Each line on the list shows the wave number, with the subscript in curly brackets, the traditional degree name, the starting date, the starting price of the S&P 500 E-mini futures, and the direction of the wave.
- S&P 500 Index:
- 5{+3} Supercycle, 7/8/1932, 4.40 (up)
- 5{+2} Cycle, 12/9/1974, 60.96 (up)
- 5{+1} Primary, 3/6/2009, 666.79 (up)
- 5{0} Intermediate, 2/11/2016, 1810.10 (up)
- 3{-1} Minor, 3/23/2020, 2191.36 (up)
- 1{-2} Minute, 7/31/2025, 6468.50 (down)
- S&P 500 Futures
- 1{-3} Minuette, 10/13/2022, 4603 (up)
- 1{-4} Subminuette, 4/7/2025, 4832 (up)
- 3{-5} Micro, 4/21/2025, 5127.25 (up)
- 5{-6} Submicro, 8/1/2025, 6249.50 (up)
- 1{-7} Minuscule, 8/1/2025, 6349.50 (up)
- 3{-8} (unnamed), 8/5/2025, 6313.25 (up)
- 4{-9} (unnamed), 8/14/2025, 6508.75 (down)
- C{-10} (unnamed), 9/22/2025, 6756.75 (down)
- 1{-11} (unnamed), 9/22/2025, 6756.75 (down)
- 3{-12} (unnamed), 9/24/2025, 6728.50 (down)
- 4{-13} (unnamed), 9/25/2025, 6624.25 (up)
- X{-14} (unnamed), 9/30/2025, 6812.25 (down)
- 1{-15} (unnamed), 10/8/2025, 6812.25 (down)
- 1{-16} (unnamed), 10/8/2025, 6812.25 (down)
Reading the chart. Price movements — waves – – in Elliott Wave Theory analysis are labeled with numbers within trending waves and letters with corrective waves. The subscripts — numbers in curly brackets — designate the wave’s degree, which, in Elliott Wave analysis, means the relative position of a wave within the larger and smaller structures that make up the chart. R.N. Elliott, who in the 1930s developed the form of analysis that bears his name, viewed the chart as a complex structure of smaller waves nested within larger waves, which in turn are nested within still larger waves. In mathematics it’s called a fractal structure, where at every scale the pattern is similar to the others.
Learning and other resources. Elliott Wave analysis provides context, not prophecy. As the 20th century semanticist Alfred Korzybski put it in his book Science and Sanity (1933), “The map is not the territory … The only usefulness of a map depends on similarity of structure between the empirical world and the map.” And I would add, in the ever-changing markets, we can judge that similarity of structure only after the fact.
See the menu page Analytical Methods for a rundown on where to go for information on Elliott Wave analysis.
By Tim Bovee, Portland, Oregon, October 9, 2025
Disclaimer
Tim Bovee, Private Trader tracks the analysis and trades of a private trader for his own accounts. Nothing in this blog constitutes a recommendation to buy or sell stocks, options or any other financial instrument. The only purpose of this blog is to provide education and entertainment.
No trader is ever 100 percent successful in his or her trades. Trading in the stock and option markets is risky and uncertain. Each trader must make trading decisions for his or her own account, and take responsibility for the consequences.
All content on Tim Bovee, Private Trader by Timothy K. Bovee is licensed under a Creative Commons Attribution-ShareAlike 4.0 International License.
Based on work at www.timbovee.com

You must be logged in to post a comment.