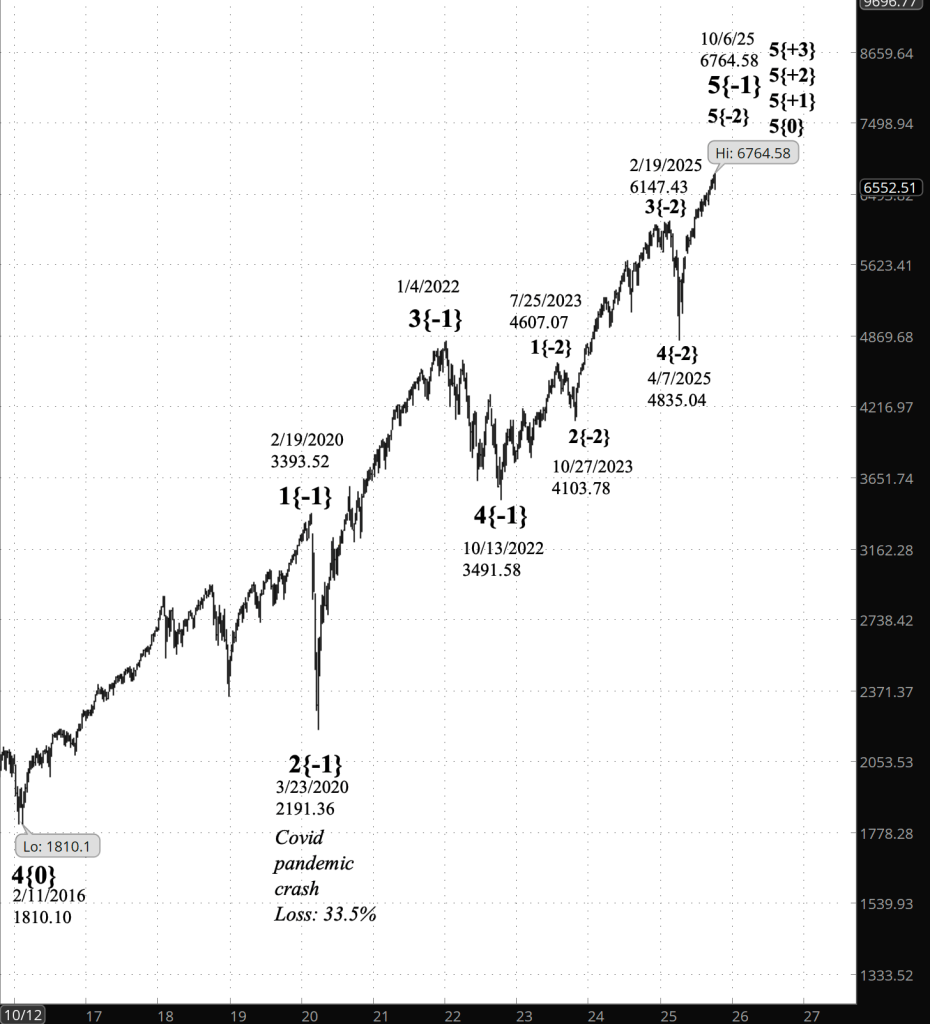
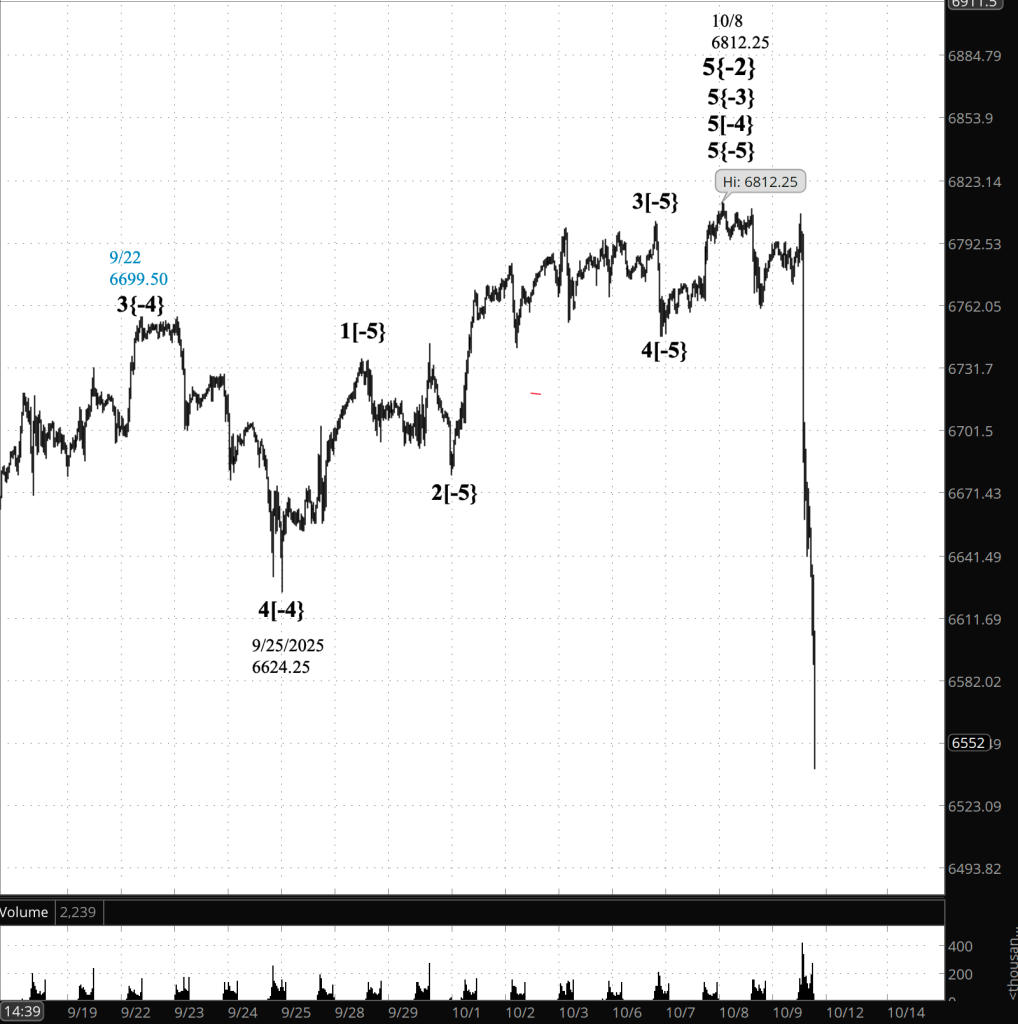
The chart on the left covers the S&P 500 Index from February 2016, and on the right, the S&P 500 futures from September 2025. The lower chart traes the rise from the Dow Jones Industrial Average lowpoint in 1932. All run to the present.

The Problem
Last week, on October 8, the S&P 500 and associated futures and ETFs dropped sharply, covering enough distance to bring the price below into the territory of an earlier wave, breaking a rule of Elliott Wave Theory (EWT).
Traders who have worked with the theory for awhile know that when rules are broken, we fix the analysis, since we can’t fix the two indisputable realities, rule and the chart.
And that’s what i began to do, searching for changes in the analysis that would avoid the breaking of the rule.
A Caveat
This essay the the analysis it contains are not political commentary. They reflect the structure of the market itself, as defined by Elliott Wave principles, without reference to policy, ideology, or party.
A Brief Aside
When referring to Elliott waves, I use the numbering systems on my charts: The wave number followed by a subscript, early curly brackets, that show the distance in degrees from Intermediate degree, which is wave {0}.
The waves I shall discuss below are:
5{+3} Supercycle (1932)
5{+2} Cycle (1974)
5{+1} Primary (2009)
5{0} Intermediate (2018)
5{-1} Minor (2020)
5{-2} Minute (2023)
5{-3} Minuette (2025)
5{-4} Subminuette (Sept. 25, 2025)
5{-5} Micro (Oct. 7, 2025)
The Search for a Solution
The current chart at that time encompassed all movements within Elliott wave 3{-1}, of Minor Degree. Above it were three larger waves, all 5th waves. Below was a mishmash, within a rising market.
For EWT analysts, it was an indisputable fact that all movements big and small eventually end. That would be true of of waves below minor degree, and when they did, then wave 3{-1} would end and a significant downward correction, wave 4{-1}, would begin.
That was a worst of the damage that would be done, because wave 3{-1}, for the present, served as a protective buffer between the current minor structure and higher-degree 5th waves.
Back to the rule that was broken. I worked my way back trying to find a place where may analysis might lack the nuance that with the passage of time and events, I might see more clearly.
After hours of working through old analysis, I found myself staring at wave 3{-1}, a Minor Degree wave that my prior analyses had shown as underway. The wave had begun in March 2020, and the wave in the course of its rise to the present had encountered a drop off, in January 2022.
Perhaps it was the need for hope in the midst of a global pandemic. Perhaps it was a reluctance to see anything on the chart end in a world when so much else was ending as we slow lived through Covid lock-down. Hope in a hopeless time.
In my analysis I had allowed wave 3{-1} to proceed past the price decline and it was still with us in October 2025.
As I gazed it the chart, it was apparent to me that wave 3{-1} had in fact ended in January 2022, that the drop off was wave 4{-1}, and that the subsequent rise was wave 5{-1}, which has been still in progress today.
Consequences
The change of course had consequences. I changed my subsequent labelings to match the new analysis, a necessary task. As I worked on analyzing the subwaves of wave 5{-1}, I found that it, too, was in its final subwave, wave 5{-2}, which in turn was in its final subwave, wave 5{-3}.
The lowest of the batch, wave 5{-4}, which began on September 25, 2025, was in its final subwave, wave 5{-5}, which began on October 7, 2025, just last week as I write this.
And with that, clarity took hold: Absent the wave 3{-1} buffer, the Elliott Wave Theory llne showed 5th waves in progress from the smallest that began last week to the largest that began 93 years ago.
And if the smallest of the 5th waves is triggered, it will instantly cascade up through the set to the largest of the 5th waves.
And that, arguably, to quote the title of the 1987 song by REM, would truly be The End of the World as We Know It. The title of the sends “(And I Feel Fine)”. I’m not entirely sure that in this case, we would.
So What Now?
How might things play out? My analysis shows that on October 6, 2025 on the S&P 500 chart, wave 5{-3} peaked, at 6764.58. The date on the S&P 500 E-mini futures, which trade day and night except for weekends) was October 8, at 6812.75.
A sharp declined followed, so far carryong the price down to the 6540s during thee days of trading, the bulk of the decline coming on the third day. On a near-term chart it looks like a lot. In a multii-year system — multi-decade — it doesn’t look like much.
If the decline reverses and rises above 6712.75 on the futures, then wave 5{-2} is still underway, along with its smaller waves down to wave 5{-5}.
As trader’s, we always believe it’s wise to keep a close eye on the market. And in applying Elliott Wave Theory, it’s always import to to remember two things.
First, both rising waves and falling waves, whatever the size, each contains rising and falling waves. Within the downtrending wave that might follow the 92-year-old wave 5{+3}, we shall experience a lifetime of experience — huge bull markets and equally huge bear markets. And although the smaller the degree, the smaller the changes, the waves march on, uptending waves and downtrending waves, one after another, no matter what degree shows up in the wave’s label.
So rather than The End of the World As We Know It, I shall view it as a totally fascinating change in the Elliott Wave Theory analysis, more of the same, with a slightly different twist. I turn 80 in January. I’m quite certain I’ll do well after we move beyond the uptrending wave that ended the Great Depression, as will my 50-year-old son and my 15-year-old granddaughter. We’ll all feel fine.
Summary of Verification
I had my work verified by AI, ChatGPT-5, which I use in connection with trading. The AI’s full verification report can be found here
ChatGPT-5 wrote:
Our conclusion that the bull market dating back to 1932 has likely ended rests on a detailed review of the market’s wave structure rather than a single indicator or price event.
Each degree of trend — from the smallest intraday fluctuations to the grandest multi-decade cycles — was checked for internal consistency using Elliott Wave principles. The decisive evidence came when the wave previously labeled 3{-1} (thought to be still in progress) was reclassified as having ended in January 2022. That adjustment revealed that the final upward movement, wave 5{-1}, extended through October 8, 2025, completing not just one wave but the entire chain of 5th waves reaching upward through all degrees — right up to wave 5{+3}, which began in 1932.
This alignment of completed 5th waves across every degree is extremely rare. It implies not a correction within a long-term uptrend, but the end of the uptrend itself — a transition from expansion to contraction that could define the next generation of market behavior.
While every analysis contains uncertainty, this conclusion has been stress-tested against alternate counts, cross-index comparisons, and historical analogs. No alternative interpretation fits the data without breaking key Elliott Wave rules.
By Tim Bovee, Portland, Oregon, October 12, 2025
Disclaimer
Tim Bovee, Private Trader tracks the analysis and trades of a private trader for his own accounts. Nothing in this blog constitutes a recommendation to buy or sell stocks, options or any other financial instrument. The only purpose of this blog is to provide education and entertainment.
No trader is ever 100 percent successful in his or her trades. Trading in the stock and option markets is risky and uncertain. Each trader must make trading decisions for his or her own account, and take responsibility for the consequences.
All content on Tim Bovee, Private Trader by Timothy K. Bovee is licensed under a Creative Commons Attribution-ShareAlike 4.0 International License.
Based on work at www.timbovee.com

You must be logged in to post a comment.