3:30 p.m. New York time
Half an hour before the closing bell. The S&P 500 futures rose to 6750.50 and then reversed, so far declining into the 6630s, with more decline to come.
Elliott Wave Theory. For this discussion I’ll use the label form that appears on my charts: Wave number with a subscript in curly brackets showing the degrees distande from Intermediate degree (presently wave 1{0}, which began on October 8 from 6812.25).
The peak marked the end of the 4th-wave upward correction that began on October 10 — wave 4{-6). Downtrending wave 5{-6} is now underway, at a rapid pace, and appears to now be in its final subwave, wave 5{-7}.
Alternatively, it could possibly be nearing the end of its first subwave, wave 1{-7} within wave 5{-6}, with wave 5{-8}, one degree lower, now underway. Time will tell which analysis fits the reality of the chart.
When wave 5[-6} is complete, it will be the end of wave 1{-5} and the beginning of an upward correction, wave 2{-5}. A 2nd wave correction, more often than not, takes the form of a Zigzag, with five subwaves in wave A{-6}. Wave B{-6} will have three subwaves, and wave C{-6} will have five subwaves, whether the form of the correction is a Zigzag or a Flat, the latter being commonly found in 4th waves but sometimes in 2nd wave.
9:35 a.m. New York time.
What’s happening now. The S&P 500 E-mini futures worked its way higher over night, from 6502.50 to the 6740s.
What does it mean? Elliott Wave Theory sees the present rise that began on October 15 as being a low-degree 5th wave, the final subwave of a C wave that began on October 14.
The C wave in turn is a subwave of the 4th-wave upward correction that began on October 10.
When wave 4 is complete, a downtending 5th wavewill begin, carrying the price into the 6540s, most likely, and perhaps well below that.
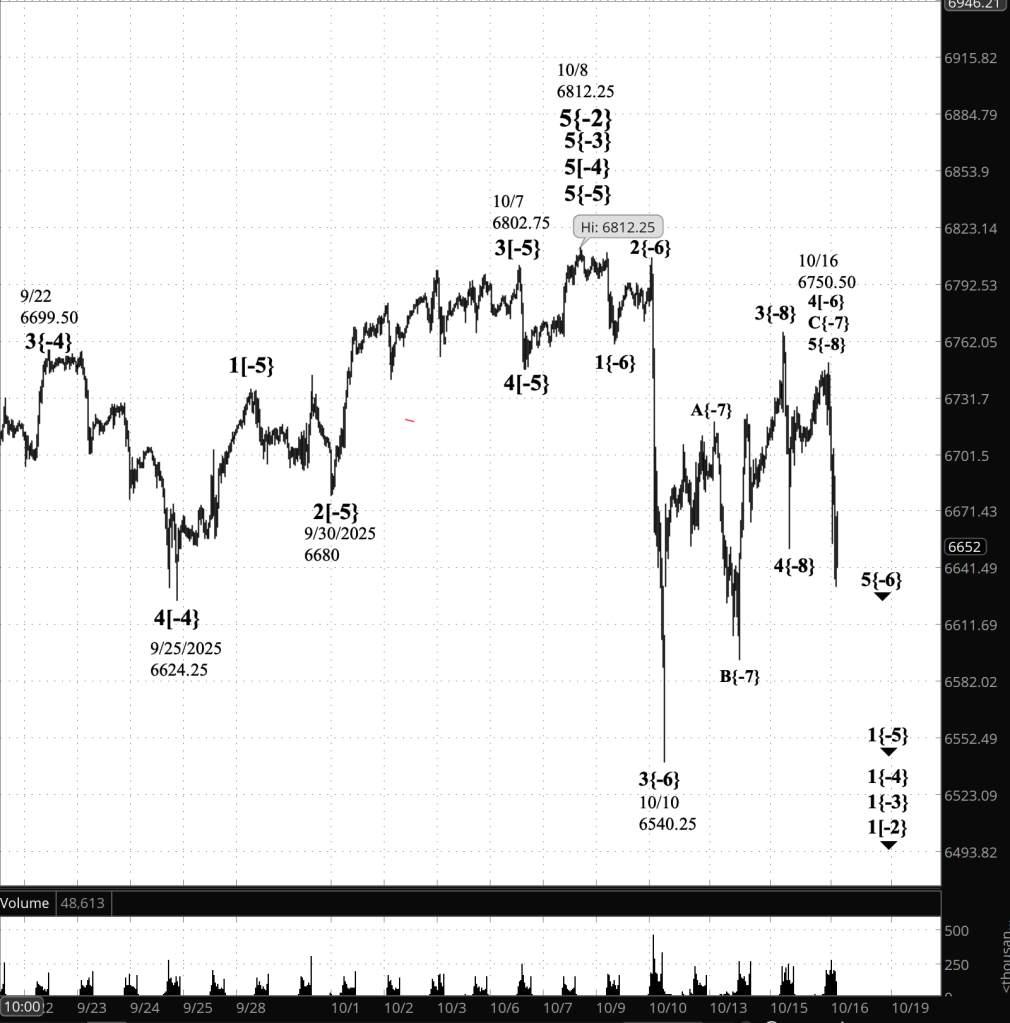
[S&P 500 E-mini futures at 3:30 p.m., 40-minute bars, with volume]
Waves Now Underway
These are the waves currently in progress under my principal analysis. Each line on the list shows the wave number, with the subscript in curly brackets, the traditional degree name, the starting date, the starting price of the S&P 500 E-mini futures, and the direction of the wave.
- 1{+4} Supermillennium, (unknown start date or start price) {down}
- A hypothetical wave one degree higher than Supercyle, needed to make the wave analysis complete.
- S&P 500 Index:
- 1{+3} Supercycle, 10/8/2025, 6812.25 (down}
- 1{+2} Cycle, 10/8/2025, 6812.25 (down}
- 1{+1} Primary, 10/8/2025, 6812.25 (down}
- 1{0} Intermediate, 10/8/2025, 6812.25 (down}
- 1{-1} Minor, 10/8/2025, 6812.25 (down}
- 1{-2} Minute, 10/8/2025, 6812.25 (down}
- S&P 500 Futures
- 1{-3} Minuette 10/8/2025, 6812.25 (down}
- 1{-4} Subminutte 10/8/2025, 6812.25 (down}
- 1{-5} Micro, 10/8/2025, 6812.25(down}
- 5{-6} Submicro, 10/16/2025, 6750.50 (down)
Reading the chart. Price movements — waves – – in Elliott Wave Theory analysis are labeled with numbers within trending waves and letters with corrective waves. The subscripts — numbers in curly brackets — designate the wave’s degree, which, in Elliott Wave analysis, means the relative position of a wave within the larger and smaller structures that make up the chart. R.N. Elliott, who in the 1930s developed the form of analysis that bears his name, viewed the chart as a complex structure of smaller waves nested within larger waves, which in turn are nested within still larger waves. In mathematics it’s called a fractal structure, where at every scale the pattern is similar to the others.
Learning and other resources. Elliott Wave analysis provides context, not prophecy. As the 20th century semanticist Alfred Korzybski put it in his book Science and Sanity (1933), “The map is not the territory … The only usefulness of a map depends on similarity of structure between the empirical world and the map.” And I would add, in the ever-changing markets, we can judge that similarity of structure only after the fact.
See the menu page Analytical Methods for a rundown on where to go for information on Elliott Wave analysis.
By Tim Bovee, Portland, Oregon, October 16, 2025
Disclaimer
Tim Bovee, Private Trader tracks the analysis and trades of a private trader for his own accounts. Nothing in this blog constitutes a recommendation to buy or sell stocks, options or any other financial instrument. The only purpose of this blog is to provide education and entertainment.
No trader is ever 100 percent successful in his or her trades. Trading in the stock and option markets is risky and uncertain. Each trader must make trading decisions for his or her own account, and take responsibility for the consequences.
All content on Tim Bovee, Private Trader by Timothy K. Bovee is licensed under a Creative Commons Attribution-ShareAlike 4.0 International License.
Based on work at www.timbovee.com

You must be logged in to post a comment.