3:30 p.m. New York time
Half an hour before the closing bell. The S&P 500 futures continued to rise after the opening bell, coming close to reaching the 6730s.
With today’s rise, wave A{-9} of wave 2{-8} has extended into the 50% retracement area of the 1{-8} decline. I expect 2{-8} to end somewhere between roughly 6735 and 6790, a slightly beneath the 4{-7} high at 6791.25. Wave A{-9} is in its final susbwave, wave 5{-10}.; Once it is complete, I expect a wave B{-9} pullback followed by C{-9} rise that will complete wave 2{-8}.
Also possible: Today’s session high is the end of wave A{-9}, and wave B{-9} has begun.
9:35 a.m. New York time.
What’s happening now. The S&P 500 E-mini futures fluctuated from the 6660s and the 6620s overnight.
What does it mean? Elliott Wave Theory sees the upward correction, wave 2{-8} as still being underway, with two ways to interpret the subwaves..
- Rising wave A{-9} is still underway, pausing at its 4t subwave before finishing it off with wave 5. This would make it a Zigzag correction, in my experience the most common pattern with a 2nd wave, although it is also found in 4th waves.
- Alternatively, Friday’s high, 6677.50, was the end of wave A{-9}, with three subwaves, and wave B{-9} has begun. Three subwaves makes wave A{-9} a Flat correction, which I’ve seen more often in 4th-wave corrections, although they sometimes turn up in 2nd waves.
So we open the week with an ambiguity that, I expect, will be resolved after the opening bell. Meanwhile, I’ve marked the chart as though the correction is a Zigzag pattern.
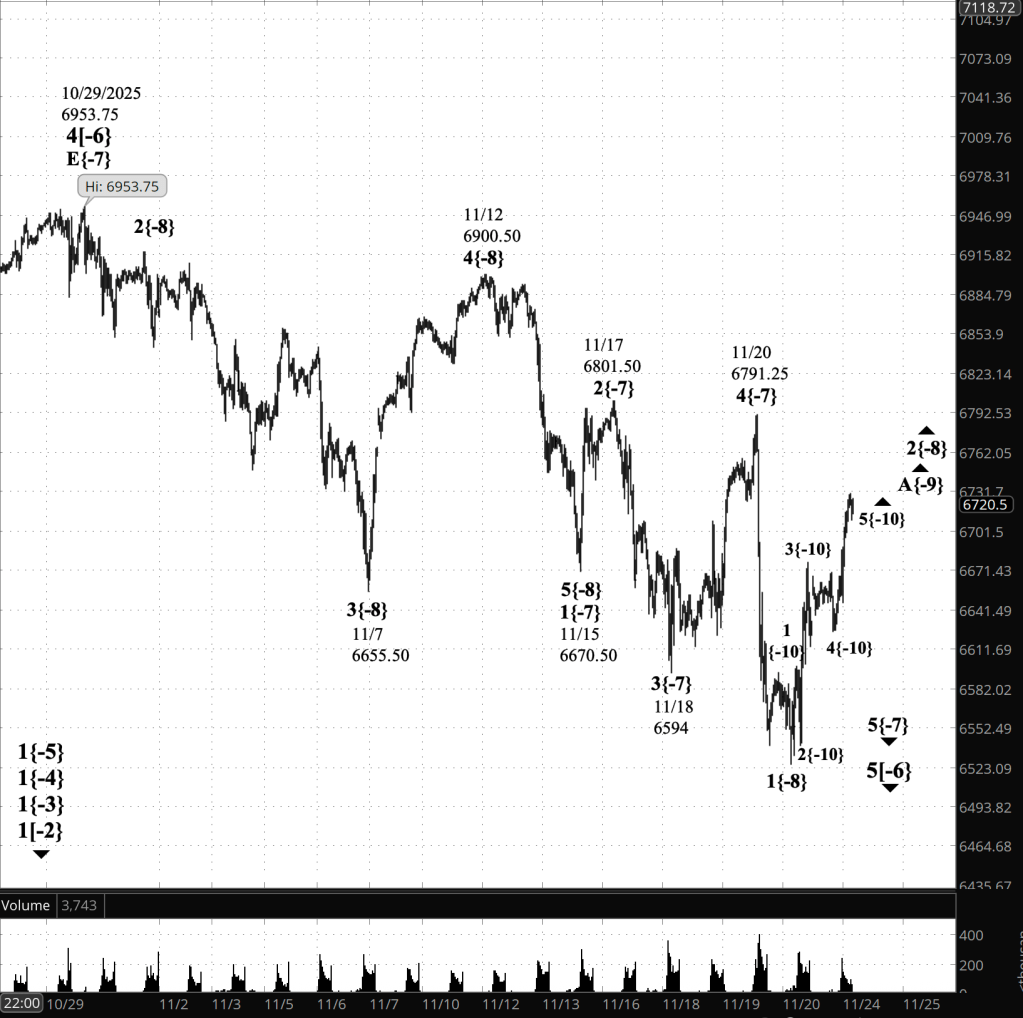
[S&P 500 E-mini futures at 3:30 p.m., 40-minute bars, with volume]
Waves Now Underway
These are the waves currently in progress under my principal analysis. Each line on the list shows the wave number, with the subscript in curly brackets, the traditional degree name, the starting date, the starting price of the S&P 500 E-mini futures, and the direction of the wave.
Most of the waves began not long ago, on October 8, 2025. See my essay posted on October 12, 2025, “The End of the Rise from 1932? Elliott Wave Theory Says ‘Yes’”, for a discussion of how that happened.
- 1{+4} Supermillennium, (unknown start date or start price) {down}
- A hypothetical wave one degree higher than Supercyle, needed to make the wave analysis complete.
- S&P 500 Index:
- 1{+3} Supercycle, 10/8/2025, 6812.25 (down}
- 1{+2} Cycle, 10/8/2025, 6812.25 (down}
- 1{+1} Primary, 10/8/2025, 6812.25 (down}
- 1{0} Intermediate, 10/8/2025, 6812.25 (down}
- 1{-1} Minor, 10/8/2025, 6812.25 (down}
- 1{-2} Minute, 10/8/2025, 6812.25 (down}
- S&P 500 Futures
- 1{-3} Minuette 10/8/2025, 6812.25 (down}
- 1{-4} Subminutte 10/8/2025, 6812.25 (down}
- 1{-5} Micro, 10/8/2025, 6812.25 (down}
- 5{-6} Submicro, 10/29/2025, 6953.75 (down)
- 5{-7} Minuscule, 11/20/2025, 6791.25 (down)
- 2{-8} (none), 11/21/2025, 6525 (up)
- A{-9} (none), 11/21/2025, 6525 (up)
Reading the chart. Price movements — waves – – in Elliott Wave Theory analysis are labeled with numbers within trending waves and letters with corrective waves. The subscripts — numbers in curly brackets — designate the wave’s degree, which, in Elliott Wave analysis, means the relative position of a wave within the larger and smaller structures that make up the chart. R.N. Elliott, who in the 1930s developed the form of analysis that bears his name, viewed the chart as a complex structure of smaller waves nested within larger waves, which in turn are nested within still larger waves. In mathematics it’s called a fractal structure, where at every scale the pattern is similar to the others.
Learning and other resources. Elliott Wave analysis provides context, not prophecy. As the 20th century semanticist Alfred Korzybski put it in his book Science and Sanity (1933), “The map is not the territory … The only usefulness of a map depends on similarity of structure between the empirical world and the map.” And I would add, in the ever-changing markets, we can judge that similarity of structure only after the fact.
See the menu page Analytical Methods for a rundown on where to go for information on Elliott Wave analysis.
By Tim Bovee, Portland, Oregon, November 24, 2025
Disclaimer
Tim Bovee, Private Trader tracks the analysis and trades of a private trader for his own accounts. Nothing in this blog constitutes a recommendation to buy or sell stocks, options or any other financial instrument. The only purpose of this blog is to provide education and entertainment.
No trader is ever 100 percent successful in his or her trades. Trading in the stock and option markets is risky and uncertain. Each trader must make trading decisions for his or her own account, and take responsibility for the consequences.
All content on Tim Bovee, Private Trader by Timothy K. Bovee is licensed under a Creative Commons Attribution-ShareAlike 4.0 International License.
Based on work at www.timbovee.com

You must be logged in to post a comment.