Holiday ahead. Thursday, November 27, is the Thanksgiving Day holiday in the United States. Markets will close at their normal time today, Wednesday, November 26, at 4 p.m. New York time. Thursday the markets will remain closed. Trading will resume on Friday, November 28, and markets will close early, at 1 p.m. New York time.
3:30 p.m. New York time.
Half an hour before the closing bell. The S&P 500 futures continued to rise during the session, reaching into the 6840s. Elliott Wave Theory: Rising wave A{-9} within the upward correction, wave 2{-8}, are underway.
9:35 a.m. New York time.
What’s happening now. The S&P 500 E-mini futures reached a peak of 6812.25 at the opening bell and continued to rise, so far reaching 6814.50.
What does it mean? Elliott Wave Theory reads the rally that began on November 21 as wave A{-9} of an upward correction, wave 2{-8}.
Yesterday we identified two likely termination clusters for wave 2:
Lower cluster: ~6735–6750
Upper cluster: ~6785–6790 (0.618 retrace + the prior 4{-7} high at 6791.25, a natural ceiling).
Overnight, /ES pushed above the upper cluster, reaching 6810.75. This suggests wave 2{-8} is stronger than expected and may be rotating toward the next retracement band near ~6815–6825 (0.786), with a secondary band near ~6850–6860 (0.886)—while remaining below the 11/12 high at 6900.50.
Wave A{-9} will be followed by a declining B{-9} wave and then a rising C{-9} wave to complete wave 2{-8}, setting the stage for a downtrending wave 3{-8}.
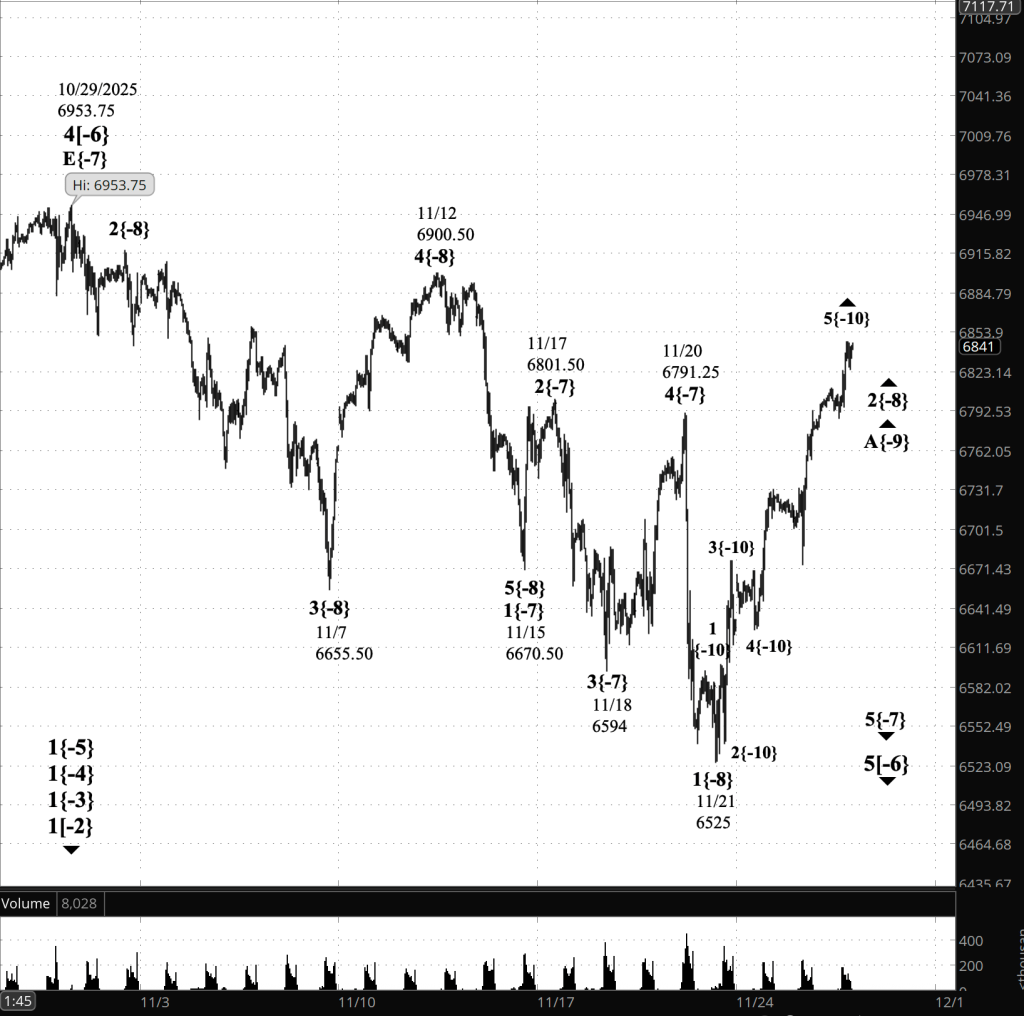
[S&P 500 E-mini futures at 3:30 p.m., 45-minute bars, with volume]
Waves Now Underway
These are the waves currently in progress under my principal analysis. Each line on the list shows the wave number, with the subscript in curly brackets, the traditional degree name, the starting date, the starting price of the S&P 500 E-mini futures, and the direction of the wave.
Most of the waves began not long ago, on October 8, 2025. See my essay posted on October 12, 2025, “The End of the Rise from 1932? Elliott Wave Theory Says ‘Yes’”, for a discussion of how that happened.
- 1{+4} Supermillennium, (unknown start date or start price) {down}
- A hypothetical wave one degree higher than Supercyle, needed to make the wave analysis complete.
- S&P 500 Index:
- 1{+3} Supercycle, 10/8/2025, 6812.25 (down}
- 1{+2} Cycle, 10/8/2025, 6812.25 (down}
- 1{+1} Primary, 10/8/2025, 6812.25 (down}
- 1{0} Intermediate, 10/8/2025, 6812.25 (down}
- 1{-1} Minor, 10/8/2025, 6812.25 (down}
- 1{-2} Minute, 10/8/2025, 6812.25 (down}
- S&P 500 Futures
- 1{-3} Minuette 10/8/2025, 6812.25 (down}
- 1{-4} Subminutte 10/8/2025, 6812.25 (down}
- 1{-5} Micro, 10/8/2025, 6812.25 (down}
- 5{-6} Submicro, 10/29/2025, 6953.75 (down)
- 5{-7} Minuscule, 11/20/2025, 6791.25 (down)
- 2{-8} (none), 11/21/2025, 6525 (up)
- A{-9} (none), 11/21/2025, 6525 (up)
Reading the chart. Price movements — waves – – in Elliott Wave Theory analysis are labeled with numbers within trending waves and letters with corrective waves. The subscripts — numbers in curly brackets — designate the wave’s degree, which, in Elliott Wave analysis, means the relative position of a wave within the larger and smaller structures that make up the chart. R.N. Elliott, who in the 1930s developed the form of analysis that bears his name, viewed the chart as a complex structure of smaller waves nested within larger waves, which in turn are nested within still larger waves. In mathematics it’s called a fractal structure, where at every scale the pattern is similar to the others.
Learning and other resources. Elliott Wave analysis provides context, not prophecy. As the 20th century semanticist Alfred Korzybski put it in his book Science and Sanity (1933), “The map is not the territory … The only usefulness of a map depends on similarity of structure between the empirical world and the map.” And I would add, in the ever-changing markets, we can judge that similarity of structure only after the fact.
See the menu page Analytical Methods for a rundown on where to go for information on Elliott Wave analysis.
By Tim Bovee, Portland, Oregon, November 26, 2025
Disclaimer
Tim Bovee, Private Trader tracks the analysis and trades of a private trader for his own accounts. Nothing in this blog constitutes a recommendation to buy or sell stocks, options or any other financial instrument. The only purpose of this blog is to provide education and entertainment.
No trader is ever 100 percent successful in his or her trades. Trading in the stock and option markets is risky and uncertain. Each trader must make trading decisions for his or her own account, and take responsibility for the consequences.
All content on Tim Bovee, Private Trader by Timothy K. Bovee is licensed under a Creative Commons Attribution-ShareAlike 4.0 International License.
Based on work at www.timbovee.com

You must be logged in to post a comment.