3:30 p.m. New York time
Half an hour before the closing bell. The S&P 500 futures continued to fall during the session, reaching into the 6750s.
Elliott Wave Theory. The decline puts the price at the low end of expectations, based on retracement Fibonacci retracement levels. I shall use the chart labels below, including the degree’s distance from Intermediate Degree.
The lower level marks the critical support for Wave B{-9} inside the developing 4{-8} correction.
A defended 6760 would enable a C{-9} advance toward 6840–6880 before completing 4{-8}.
A decisive break below 6760, especially under 6735, shifts probabilities toward a deeper negative-degree sequence, potentially filling the 6708 level and targeting the 6680–6660 region.
End-point guessing is not a precision activity in Elliott Wave Theory. It’s a forecasting tool, and just like the weather forecast, sometimes it’s right, and sometimes, not so much.
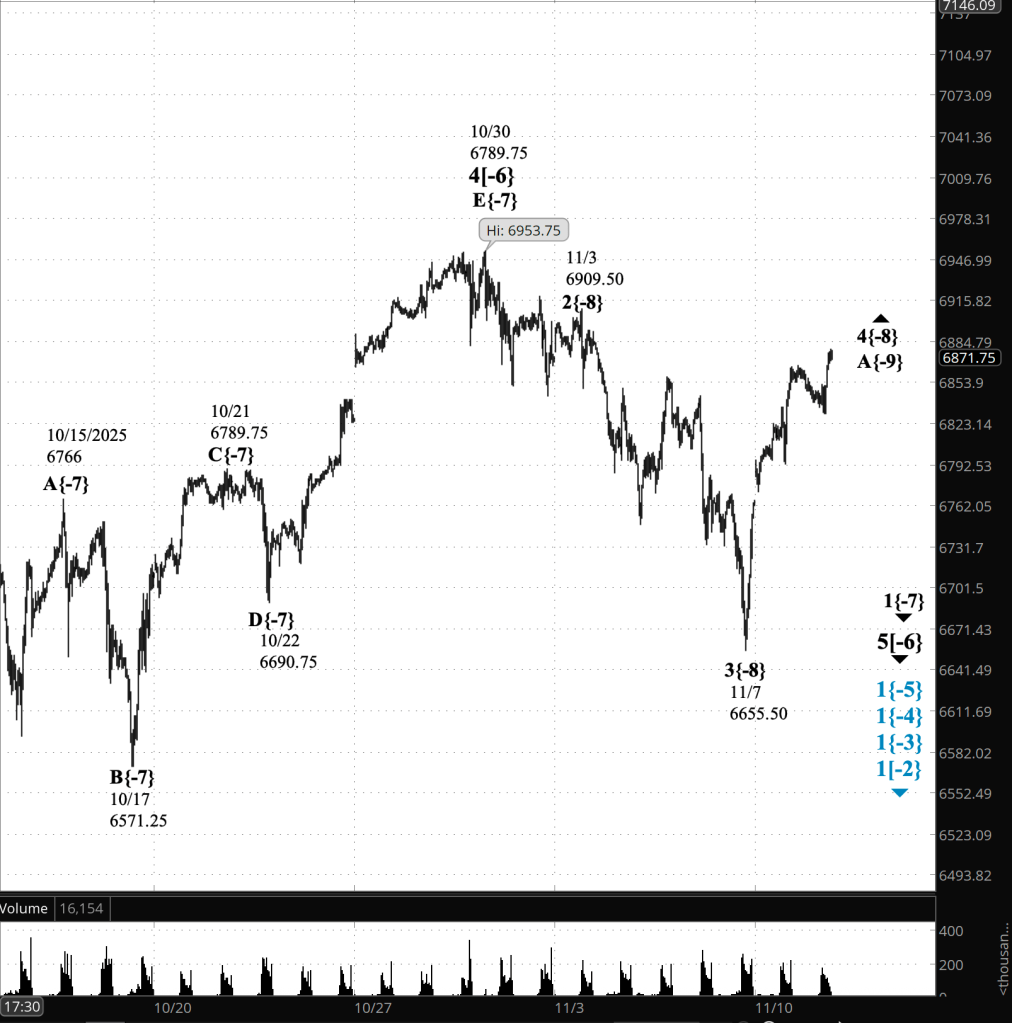
9:35 a.m. New York time.
What’s happening now. The S&P 500 E-mini futures reached a high overnight of 6892.50 and then declined, so far reaching into the 6840s
What does it mean? Elliott Wave Theory analysis sees the decline as a B wave, the middle subwave of an upward correction, wave 4.
How low can it go? The B wave is a zigzag, with five subwaves within wave A. Wave B is most likely to retrace between 38.2% and 50% of wave A (both Fibonacci levels). That works out to be between 6807 and 6778, more or less. There are a lot of variations in retracement length.
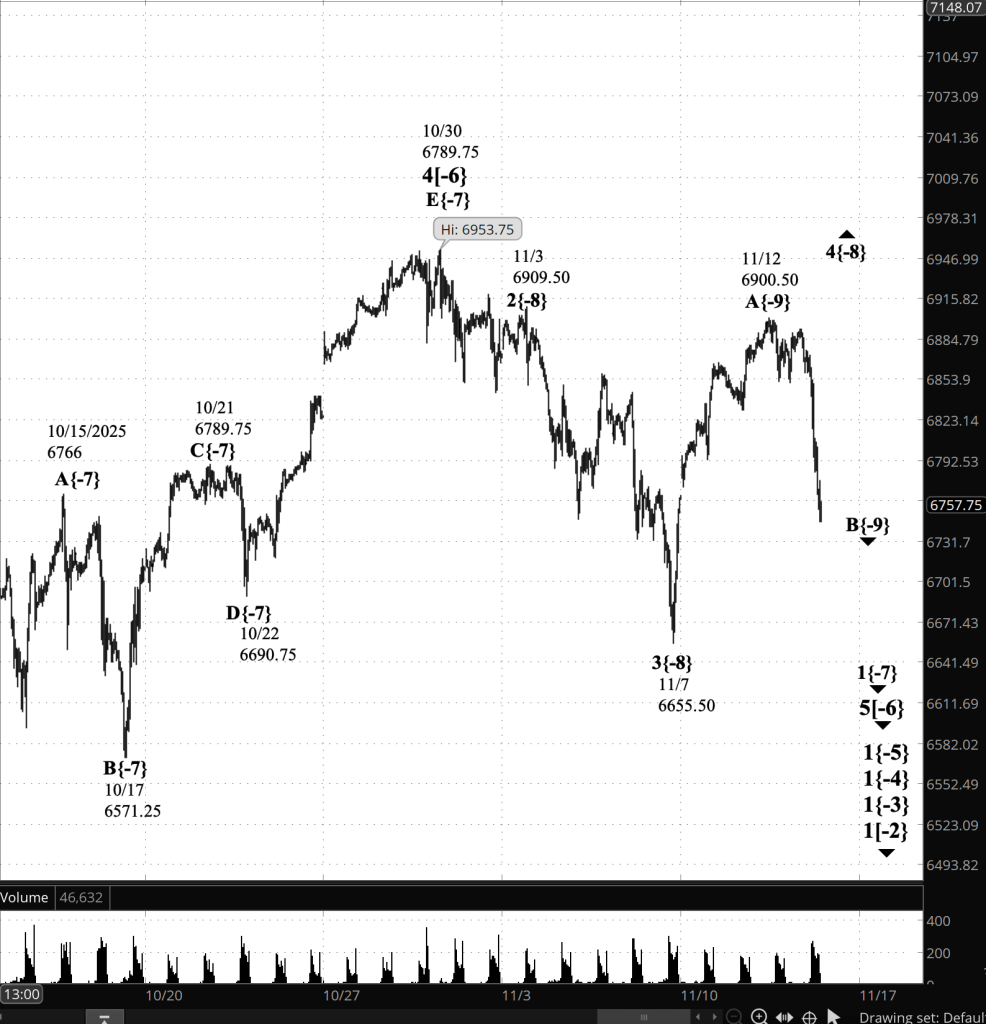
[S&P 500 E-mini futures at 3:30 p.m., 50-minute bars, with volume]
Waves Now Underway
These are the waves currently in progress under my principal analysis. Each line on the list shows the wave number, with the subscript in curly brackets, the traditional degree name, the starting date, the starting price of the S&P 500 E-mini futures, and the direction of the wave.
- 1{+4} Supermillennium, (unknown start date or start price) {down}
- A hypothetical wave one degree higher than Supercyle, needed to make the wave analysis complete.
- S&P 500 Index:
- 1{+3} Supercycle, 10/8/2025, 6812.25 (down}
- 1{+2} Cycle, 10/8/2025, 6812.25 (down}
- 1{+1} Primary, 10/8/2025, 6812.25 (down}
- 1{0} Intermediate, 10/8/2025, 6812.25 (down}
- 1{-1} Minor, 10/8/2025, 6812.25 (down}
- 1{-2} Minute, 10/8/2025, 6812.25 (down}
- S&P 500 Futures
- 1{-3} Minuette 10/8/2025, 6812.25 (down}
- 1{-4} Subminutte 10/8/2025, 6812.25 (down}
- 2{-5} Micro, 10/17/2025, 6571.25 (up}
- 5{-6} Submicro, 10/30/2025, 6853.75 (down)
- 1{-7} Minscule, 10/30/2025, 6853.75 (down)
- 4{-8} (no name), 11/3/2025, 6909.50 (up)
- B{-9} (no name), 11/12/2025, 6900.50 (down)
Reading the chart. Price movements — waves – – in Elliott Wave Theory analysis are labeled with numbers within trending waves and letters with corrective waves. The subscripts — numbers in curly brackets — designate the wave’s degree, which, in Elliott Wave analysis, means the relative position of a wave within the larger and smaller structures that make up the chart. R.N. Elliott, who in the 1930s developed the form of analysis that bears his name, viewed the chart as a complex structure of smaller waves nested within larger waves, which in turn are nested within still larger waves. In mathematics it’s called a fractal structure, where at every scale the pattern is similar to the others.
Learning and other resources. Elliott Wave analysis provides context, not prophecy. As the 20th century semanticist Alfred Korzybski put it in his book Science and Sanity (1933), “The map is not the territory … The only usefulness of a map depends on similarity of structure between the empirical world and the map.” And I would add, in the ever-changing markets, we can judge that similarity of structure only after the fact.
See the menu page Analytical Methods for a rundown on where to go for information on Elliott Wave analysis.
By Tim Bovee, Portland, Oregon, November 13, 2025
Disclaimer
Tim Bovee, Private Trader tracks the analysis and trades of a private trader for his own accounts. Nothing in this blog constitutes a recommendation to buy or sell stocks, options or any other financial instrument. The only purpose of this blog is to provide education and entertainment.
No trader is ever 100 percent successful in his or her trades. Trading in the stock and option markets is risky and uncertain. Each trader must make trading decisions for his or her own account, and take responsibility for the consequences.
All content on Tim Bovee, Private Trader by Timothy K. Bovee is licensed under a Creative Commons Attribution-ShareAlike 4.0 International License.
Based on work at www.timbovee.com


You must be logged in to post a comment.