3:30 p.m. New York time
Half an hour before the closing bell. The S&P 500 futures rose during the session, coming within 10 points of the overnight high at 6854.50, and then reversed, falling back into the 6820s.
Elliott Wave Theory: The fact that price stayed below the 6854.50 peak added credence to the view that wave A{-9} within the upward correction, wave 2{-8}, has ended and wave B{-9} is underway.
A separate element would increase confidence in the wave B{-9} scenario if price breaks and holds below roughly 6815–6800. Today that narrow zone was tested twice, once overnight and once during the session, but it was not convincingly broken and held below.
The ambiguity remains, but it is leaning toward the wave B{-9} scenario. With a strong awareness of the uncertainty, I have changed the labeling to the wave B scenario: rising wave A has ended, declining wave B has begun, and rising wave C lies ahead, all within the parent wave, rising wave 2. Invalidation would be a recovery through 6854.50, which would suggest wave A{-9} is not complete or that wave B{-9} is failing.
9:35 a.m. New York time.
What’s happening now. The S&P 500 E-mini futures resumed trading and quickly rose to a high, 6864.50. It then reversed and so far has fallen to a low of 6502.
What does it mean? The decline, viewed through Elliott Wave Theory analysis, once again poses a question: Is 6502 the end of wave A{-9}, a subwave of an upward correction, wave 2{-8}? Or does wave A{-9} have more upside ahead of it?
If wave A{-9} is complete, then declining wave B{9} is underway.
For now I shall leave the chart as it was — wave A{-9} in progress. The reversal looks real, but it’s shallow and not confirmed in any meaningful way. I shall look for confirmation in what happens next:
- Wave B{-9} is underway if the price fails to regain/hold above ~6846–6854.5 on any bounce, and especially if it breaks below the nearby swing support (~6800/6815 zone) with follow-through.
- Wave A{9} most likely continues if the price reclaims 6854.50 and holds above it (that suggests A{-9} is extending rather than ending).
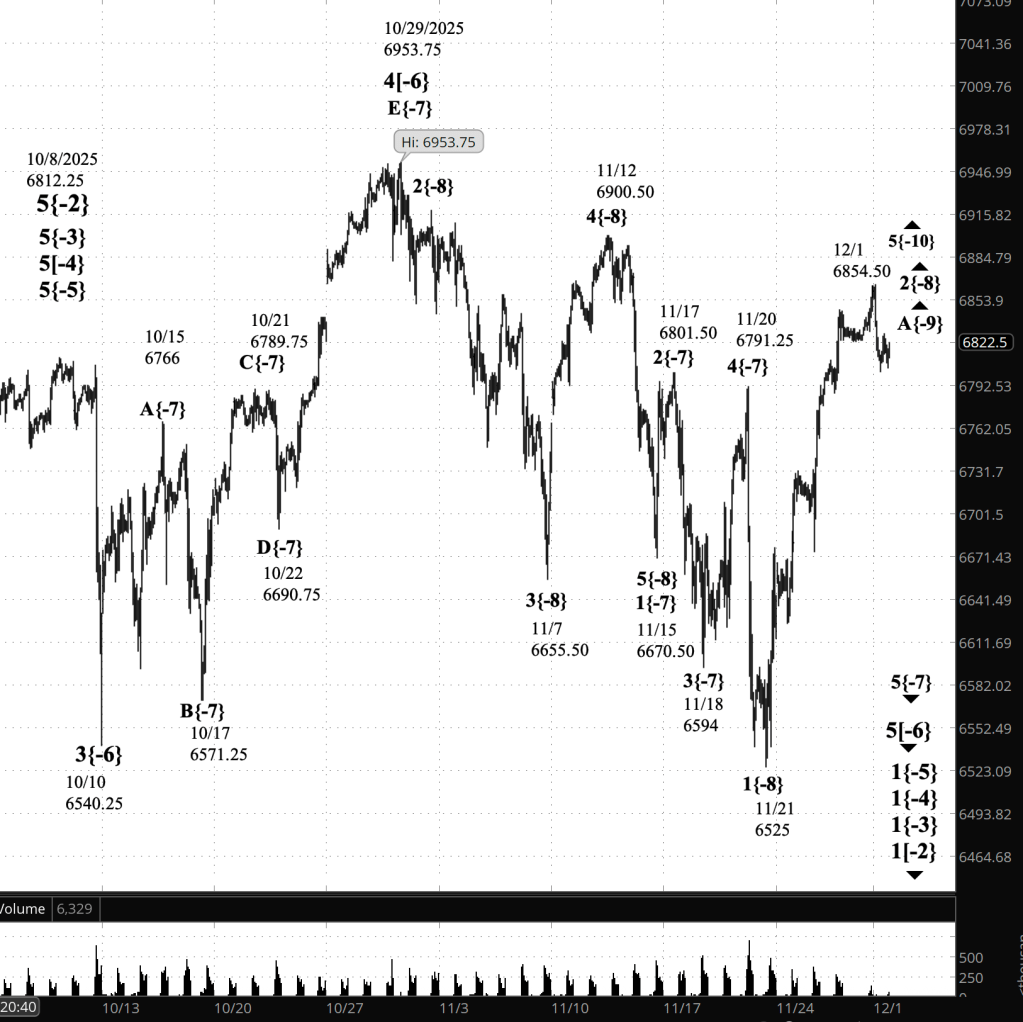
[S&P 500 E-mini futures at 3:30 p.m., 80-minute bars, with volume]
Waves Now Underway
These are the waves currently in progress under my principal analysis. Each line on the list shows the wave number, with the subscript in curly brackets, the traditional degree name, the starting date, the starting price of the S&P 500 E-mini futures, and the direction of the wave.
Most of the waves began not long ago, on October 8, 2025. See my essay posted on October 12, 2025, “The End of the Rise from 1932? Elliott Wave Theory Says ‘Yes’”, for a discussion of how that happened.
- 1{+4} Supermillennium, (unknown start date or start price) {down}
- A hypothetical wave one degree higher than Supercyle, needed to make the wave analysis complete.
- S&P 500 Index:
- 1{+3} Supercycle, 10/8/2025, 6812.25 (down}
- 1{+2} Cycle, 10/8/2025, 6812.25 (down}
- 1{+1} Primary, 10/8/2025, 6812.25 (down}
- 1{0} Intermediate, 10/8/2025, 6812.25 (down}
- 1{-1} Minor, 10/8/2025, 6812.25 (down}
- 1{-2} Minute, 10/8/2025, 6812.25 (down}
- S&P 500 Futures
- 1{-3} Minuette 10/8/2025, 6812.25 (down}
- 1{-4} Subminutte 10/8/2025, 6812.25 (down}
- 1{-5} Micro, 10/8/2025, 6812.25 (down}
- 5{-6} Submicro, 10/29/2025, 6953.75 (down)
- 5{-7} Minuscule, 11/20/2025, 6791.25 (down)
- 2{-8} (none), 11/21/2025, 6525 (up)
- B{-9} (none), 12/1/2025, 6954.50 (down)
Reading the chart. Price movements — waves – – in Elliott Wave Theory analysis are labeled with numbers within trending waves and letters with corrective waves. The subscripts — numbers in curly brackets — designate the wave’s degree, which, in Elliott Wave analysis, means the relative position of a wave within the larger and smaller structures that make up the chart. R.N. Elliott, who in the 1930s developed the form of analysis that bears his name, viewed the chart as a complex structure of smaller waves nested within larger waves, which in turn are nested within still larger waves. In mathematics it’s called a fractal structure, where at every scale the pattern is similar to the others.
Learning and other resources. Elliott Wave analysis provides context, not prophecy. As the 20th century semanticist Alfred Korzybski put it in his book Science and Sanity (1933), “The map is not the territory … The only usefulness of a map depends on similarity of structure between the empirical world and the map.” And I would add, in the ever-changing markets, we can judge that similarity of structure only after the fact.
See the menu page Analytical Methods for a rundown on where to go for information on Elliott Wave analysis.
By Tim Bovee, Portland, Oregon, December 1, 2025
Disclaimer
Tim Bovee, Private Trader tracks the analysis and trades of a private trader for his own accounts. Nothing in this blog constitutes a recommendation to buy or sell stocks, options or any other financial instrument. The only purpose of this blog is to provide education and entertainment.
No trader is ever 100 percent successful in his or her trades. Trading in the stock and option markets is risky and uncertain. Each trader must make trading decisions for his or her own account, and take responsibility for the consequences.
All content on Tim Bovee, Private Trader by Timothy K. Bovee is licensed under a Creative Commons Attribution-ShareAlike 4.0 International License.
Based on work at www.timbovee.com

You must be logged in to post a comment.