3:30 p.m. New York time
Half an hour before the closing bell, the S&P 500 E-mini futures reversed from the pre-session peak at 6884.75 and fell to a session low so far of 6836.25.
Elliott Wave Theory: At the risk of hearing voices muttering, “Yeah, heard that before,” I’m now labeling the 6884.75 high as the end of rising wave A{-9}, with declining wave B{-9} underway. On the chart, the signature is a swift decline followed by messy, overlapping price action—a pattern that is often consistent with early B-wave behavior.
Waves are driven by the opinions behind trades, whether those opinions belong to individual humans or to algorithms programmed by humans. In that sense, wave structure is an aggregate of moment-by-moment “opinion polls.” And today’s polling suggests uncertainty: is wave A{-9} ready to extend to new highs, or has it played out, making room for wave B{-9}?
The honest answer is: we don’t know yet. But we do have guidelines.
At this stage, the decline is still a shallow retracement of the full advance that began on November 21. Confirmation will therefore be behavioral, not philosophical: repeated failed bounces below the 6880–6885 area and follow-through below 6836.25 would strengthen the B-wave interpretation. Conversely, a sustained move above 6884.75 would erase the B-wave scenario in favor of a continuation of wave A{-9}.
11:05 a.m. New York time
Ambiguities resolved. The problem with wave A{-9} within wave 2{-8} is that it overlaps the start of wave 1{-8}, the first subwave of wave 5{-7}. That breaks a rule of normal corrections under Elliott Wave Theory. The ambiguity lay in trying to explain how that is possible.
At this point I find it useful to keep in mind that the Elliott Wave Theory analysis is a map, and the underlying reality is the chart. Whatever rules the map ought to adhere to, the underlying reality stands, and it’s up to the map designer (that’s me) to match the reality.
Here’s what I’ve concluded.
The wave labeling in the 9:35 a.m. post stands: The decline into November 21 (6525) is wave 1{-8} following the end of wave 4{-7} on November 20, and the advance since then is wave 2{-8}. Within that correction, wave A{-9} is underway.
Wave 2’s rise beyond the starting point of wave 1 can be mapped as one of the variants of Elliiott Wave Theory, by treating wave 2{-8} as a Diagonal-variant correction. Unlike the more common three-wave corrections (Zigzag, Flat), the Diagonal with its five subwaves can move beyond the start of the preceding 5th wave.
There’s no need to redo the labeling. It does require some changes in the way we think about this part of the chart. A{-9} is unfolding as a five-subwave advance; if its internal wave 4 overlaps wave 1 and the advance forms a wedge, it would qualify as a leading diagonal (“diagonal triangle” in the book Elliott Wave Principle by A.J. Frost and Robert Prechter).
The remaining open question is not whether a triangle is possible, but whether the expanding triangle subtype will be confirmed. That requires the next swings to clearly widen (push beyond prior swing extremes); until then, “triangle candidate” is the most precise description.
And as I was working through the analysis, the S&P 500 futures peaked at 6880.75, and plunged to 6844.50, perhaps marking the end of rising wave A{-9} and the start of falling wave B{-9}. So it goes. In Elliott Wave Theory, the map is always changing as the waves march on.
I’ve updated the chart.
9:35 a.m. New York time.
What’s happening now. After a quiet overnight rotation, the S&P 500 E-mini futures put in a tight range and then popped higher on the morning economic release. On the 5-minute chart, the session’s working range has been roughly 6854.25–6880.75, with the late move breaking above the prior chop.
What does it mean? Today’s key catalyst was Initial Jobless Claims, which came in meaningfully lower than expected (Reuters: 191,000 vs. 220,000 forecast, lowest since Sept. 2022), reinforcing the idea that layoffs remain historically low. Reuters
There is a great deal of ambiguity in the chart, and my project today will be puzzling it out. From an Elliott Wave perspective, this still looks like a corrective environment rather than an impulse trend.
An alternative interpretation is that the decline into 11/21 (6525) is best treated as a higher-degree corrective leg (an A-wave) and the rise since then as a B-wave within an expanded flat. In expanded flats, B-waves can retrace deeply and even exceed prior extremes—so the “overlap” behavior is not only allowed, it’s typical.
Near-term expectation: choppy, overlapping swings remain likely, and today’s spike can be viewed as part of the ongoing B-wave advance rather than proof that a new impulse is underway.
Key levels (intraday):
- Resistance / breakout reference: ~6881 (session high area)
- Support to watch: ~6854 (session low area)
I’ve left the wave labels as they were for now: Wave A{-9} within wave 2{-8} is underway. That may change with the afternoon analysis.
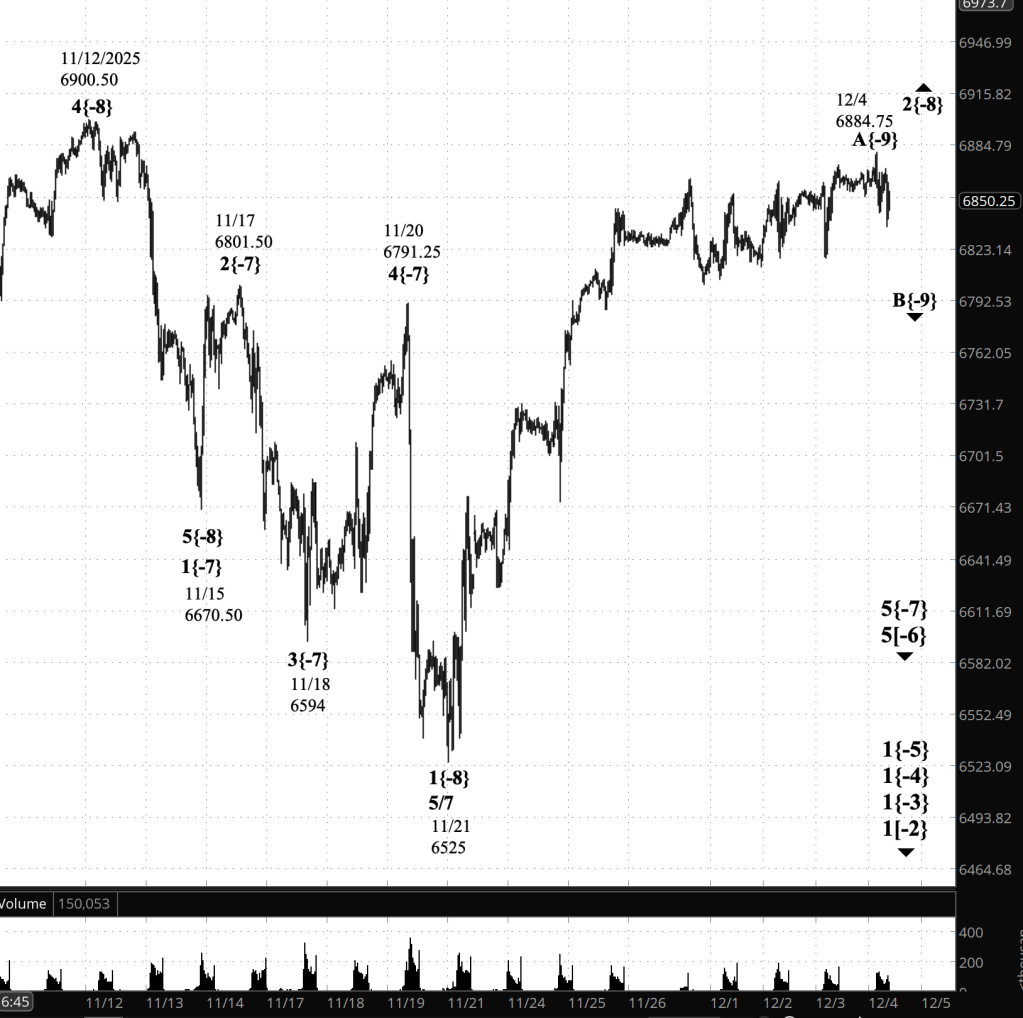
[S&P 500 E-mini futures at 3:30 p.m., 35-minute bars, with volume]
Waves Now Underway
These are the waves currently in progress under my principal analysis. Each line on the list shows the wave number, with the subscript in curly brackets, the traditional degree name, the starting date, the starting price of the S&P 500 E-mini futures, and the direction of the wave.
Most of the waves began not long ago, on October 8, 2025. See my essay posted on October 12, 2025, “The End of the Rise from 1932? Elliott Wave Theory Says ‘Yes’”, for a discussion of how that happened.
- 1{+4} Supermillennium, (unknown start date or start price) {down}
- A hypothetical wave one degree higher than Supercyle, needed to make the wave analysis complete.
- S&P 500 Index:
- 1{+3} Supercycle, 10/8/2025, 6812.25 (down}
- 1{+2} Cycle, 10/8/2025, 6812.25 (down}
- 1{+1} Primary, 10/8/2025, 6812.25 (down}
- 1{0} Intermediate, 10/8/2025, 6812.25 (down}
- 1{-1} Minor, 10/8/2025, 6812.25 (down}
- 1{-2} Minute, 10/8/2025, 6812.25 (down}
- S&P 500 Futures
- 1{-3} Minuette 10/8/2025, 6812.25 (down}
- 1{-4} Subminutte 10/8/2025, 6812.25 (down}
- 1{-5} Micro, 10/8/2025, 6812.25 (down}
- 5{-6} Submicro, 10/29/2025, 6953.75 (down)
- 5{-7} Minuscule, 11/20/2025, 6791.25 (down)
- 2{-8} (none), 11/21/2025, 6525 (up)
- B{-9} (none), 12/4/2025, 6884.75 (down)
Reading the chart. Price movements — waves – – in Elliott Wave Theory analysis are labeled with numbers within trending waves and letters with corrective waves. The subscripts — numbers in curly brackets — designate the wave’s degree, which, in Elliott Wave analysis, means the relative position of a wave within the larger and smaller structures that make up the chart. R.N. Elliott, who in the 1930s developed the form of analysis that bears his name, viewed the chart as a complex structure of smaller waves nested within larger waves, which in turn are nested within still larger waves. In mathematics it’s called a fractal structure, where at every scale the pattern is similar to the others.
Learning and other resources. Elliott Wave analysis provides context, not prophecy. As the 20th century semanticist Alfred Korzybski put it in his book Science and Sanity (1933), “The map is not the territory … The only usefulness of a map depends on similarity of structure between the empirical world and the map.” And I would add, in the ever-changing markets, we can judge that similarity of structure only after the fact.
See the menu page Analytical Methods for a rundown on where to go for information on Elliott Wave analysis.
By Tim Bovee, Portland, Oregon, December 4, 2025
Disclaimer
Tim Bovee, Private Trader tracks the analysis and trades of a private trader for his own accounts. Nothing in this blog constitutes a recommendation to buy or sell stocks, options or any other financial instrument. The only purpose of this blog is to provide education and entertainment.
No trader is ever 100 percent successful in his or her trades. Trading in the stock and option markets is risky and uncertain. Each trader must make trading decisions for his or her own account, and take responsibility for the consequences.
All content on Tim Bovee, Private Trader by Timothy K. Bovee is licensed under a Creative Commons Attribution-ShareAlike 4.0 International License.
Based on work at www.timbovee.com

You must be logged in to post a comment.