3:30 p.m. New York time
Half an hour before the closing bell. The S&P 500 futures whipsawed higher after the Federal Open Market Committee cut the target range by ¼ point to 3.50%–3.75%. The first reaction spike topped at 6861.75 and faded quickly, but the tone shifted during Powell’s news coferende: about five minutes in, the futures pushed higher again, tagging 6886.75, holding in that area, and then rising further, to above 6906.75, which is $1.75 above the prior peak within the rise that began on November 21, 6905.
Elliott Wave Theory: That reclaim-and-hold above the prior resistance shelf near 6885 strengthens the case that Wave A{-9} is still underway (or extending), so I’ve kept the existing A{-9} labeling on the chart. A reversal back under the earlier breakout area would be the first warning that the move was only a headline pop rather than a sustained continuation.
9:35 a.m. New York time.
What’s happening now. The S&P 500 E-mini futures once again traded narrowly overnight, tracing a net sideways pattern. And once again the movement raised the question, has the rise that began on November 21 refersed, taking the S&P 500 in a new direction?
What does it mean? Elliott Wave Theory sees the rise as being wave A{-9} within an upward correction, wave 2{-8}. If wave rising A{-9} truly ended at the most recent peak in the rise, 6906 on December 5, then falling wave B{-9} has begun.
The ChatGPT AI’s estimate of whether the resistance levels and what answer they imply to the question.
“Overnight the S&P 500 futures are still coiling in a tight pre-FOMC box (~6859–6834), which keeps the central question alive: was 6906 (12/5) the end of Wave A{-9}, meaning Wave B{-9} has begun? As long as price fails to reclaim 6859 with follow-through, the simplest read is that B{-9} is already in progress as a corrective/consolidative phase. To weaken that call, bulls need acceptance above ~6885 (nearest resistance shelf) and then a return to 6905–6906; a clean breakout above 6906 would argue that the correction is ending and the larger upward structure is reasserting itself. Until then, this looks like ‘marking time’ into the 2:00 p.m. ET FOMC catalyst rather than a resolved trend.”
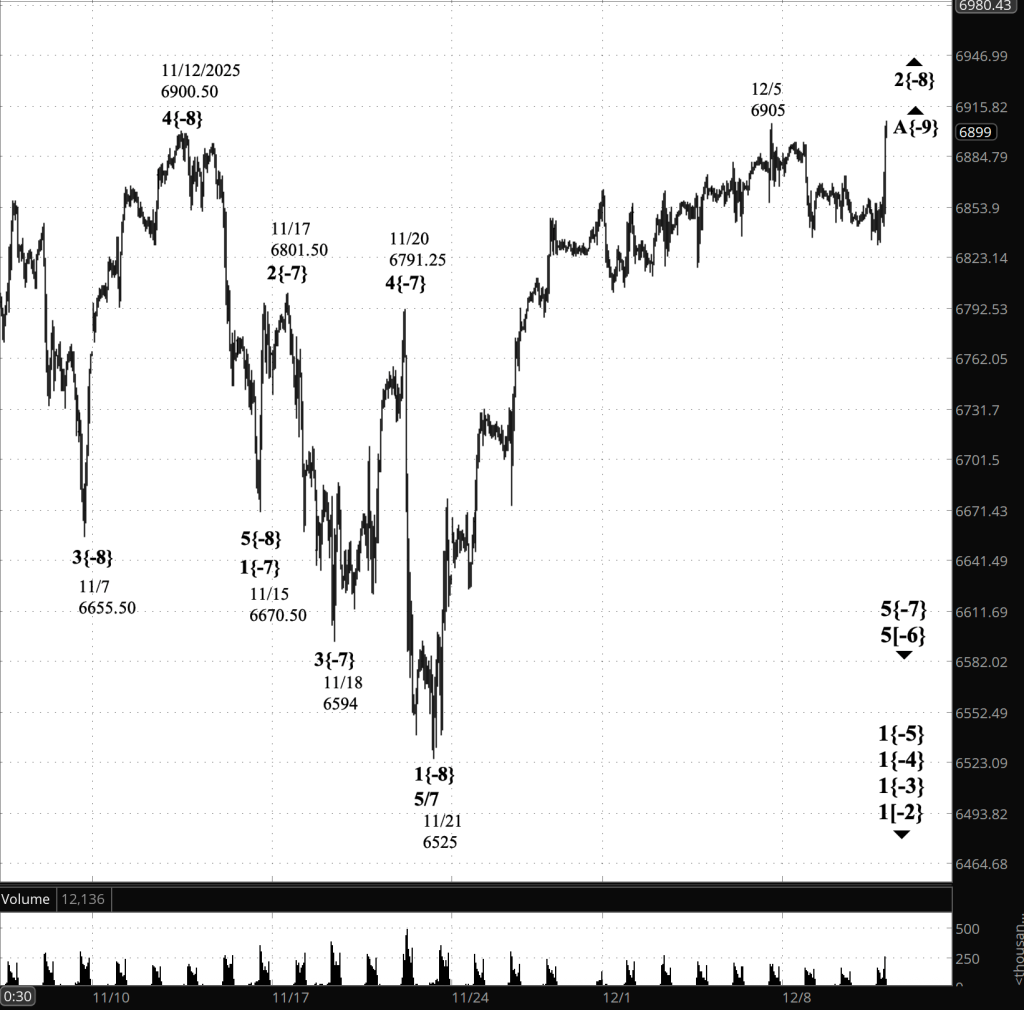
[S&P 500 E-mini futures at 3:30 p.m., 50-minute bars, with volume]
Waves Now Underway
These are the waves currently in progress under my principal analysis. Each line on the list shows the wave number, with the subscript in curly brackets, the traditional degree name, the starting date, the starting price of the S&P 500 E-mini futures, and the direction of the wave.
Most of the waves began not long ago, on October 8, 2025. See my essay posted on October 12, 2025, “The End of the Rise from 1932? Elliott Wave Theory Says ‘Yes’”, for a discussion of how that happened.
The difficult problem of estimating when a wave change should be accept as real rather than a headfake is addressed by the essay titled, “Is This Reversal Real?: How to Tell Without Being Whipsawed”.
- 1{+4} Supermillennium, (unknown start date or start price) {down}
- A hypothetical wave one degree higher than Supercyle, needed to make the wave analysis complete.
- S&P 500 Index:
- 1{+3} Supercycle, 10/8/2025, 6812.25 (down}
- 1{+2} Cycle, 10/8/2025, 6812.25 (down}
- 1{+1} Primary, 10/8/2025, 6812.25 (down}
- 1{0} Intermediate, 10/8/2025, 6812.25 (down}
- 1{-1} Minor, 10/8/2025, 6812.25 (down}
- 1{-2} Minute, 10/8/2025, 6812.25 (down}
- S&P 500 Futures
- 1{-3} Minuette 10/8/2025, 6812.25 (down}
- 1{-4} Subminutte 10/8/2025, 6812.25 (down}
- 1{-5} Micro, 10/8/2025, 6812.25 (down}
- 5{-6} Submicro, 10/29/2025, 6953.75 (down)
- 5{-7} Minuscule, 11/20/2025, 6791.25 (down)
- 2{-8} (none), 11/21/2025, 6525 (up)
- A{-9} (none), 11/21/2025, 6525 (up)
Reading the chart. Price movements — waves – – in Elliott Wave Theory analysis are labeled with numbers within trending waves and letters with corrective waves. The subscripts — numbers in curly brackets — designate the wave’s degree, which, in Elliott Wave analysis, means the relative position of a wave within the larger and smaller structures that make up the chart. R.N. Elliott, who in the 1930s developed the form of analysis that bears his name, viewed the chart as a complex structure of smaller waves nested within larger waves, which in turn are nested within still larger waves. In mathematics it’s called a fractal structure, where at every scale the pattern is similar to the others.
Learning and other resources. Elliott Wave analysis provides context, not prophecy. As the 20th century semanticist Alfred Korzybski put it in his book Science and Sanity (1933), “The map is not the territory … The only usefulness of a map depends on similarity of structure between the empirical world and the map.” And I would add, in the ever-changing markets, we can judge that similarity of structure only after the fact.
See the menu page Analytical Methods for a rundown on where to go for information on Elliott Wave analysis.
By Tim Bovee, Portland, Oregon, December 10, 2025
Disclaimer
Tim Bovee, Private Trader tracks the analysis and trades of a private trader for his own accounts. Nothing in this blog constitutes a recommendation to buy or sell stocks, options or any other financial instrument. The only purpose of this blog is to provide education and entertainment.
No trader is ever 100 percent successful in his or her trades. Trading in the stock and option markets is risky and uncertain. Each trader must make trading decisions for his or her own account, and take responsibility for the consequences.
All content on Tim Bovee, Private Trader by Timothy K. Bovee is licensed under a Creative Commons Attribution-ShareAlike 4.0 International License.
Based on work at www.timbovee.com

You must be logged in to post a comment.